Did You Know?
Did you know that states differ in the percentages of people with disabilities living there by age?
The 2016 Disability Statistics Annual Report contains maps that show state variation in the percentage of people with disabilities by age, demonstrating how disability increases with age.
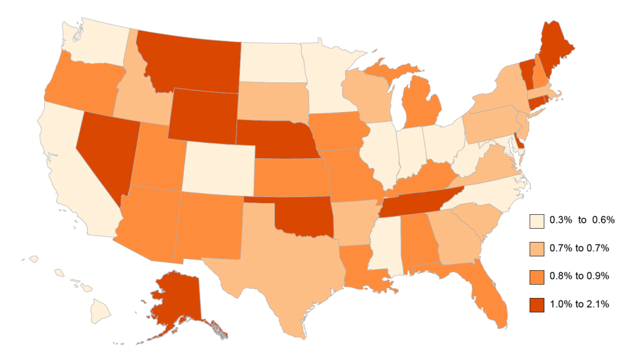 In this first map, the percentage of disability in those ages 5 and under was very low, about 0.8% nationally, 2.1% or less in any state. The states with the highest percentages were Alaska and Nevada. Six states and the District of Columbia had percentages equal to or less than 0.5%.
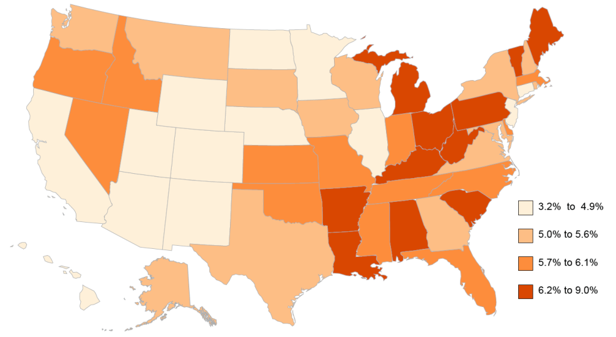 The second map shows, for children ages 5-17, that the percentages of those with a disability ranged from 3.2% in Hawaii to almost triple that percentage in Vermont at 9.0%. In general, percentages for this age group were lower in the states around the Rockies, the upper Great Plains, the Pacific Coast and Hawaii, and more concentrated in the eastern and southern US.
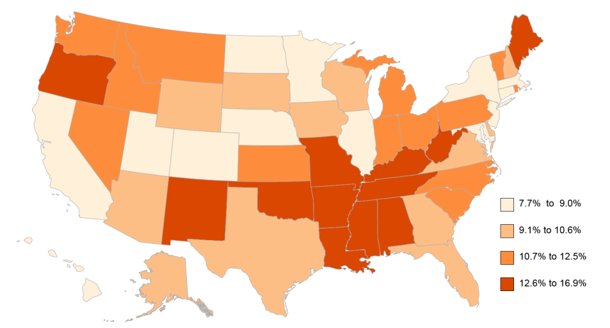 The third map shows, for adults ages 18-64, the highest percentages of people with disabilities were in states in the southern US from Oklahoma to West Virginia, and also Maine and Oregon. The percentage was lowest in Hawaii and New Jersey (7.7%) and more than twice as high in West Virginia (16.9%).
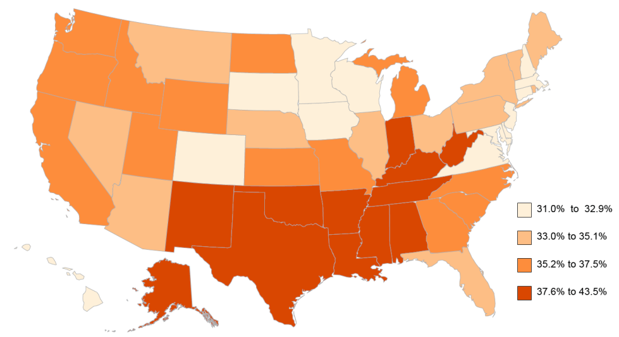 The final map shows that the highest percentages of disability were in the US population 65 and over. In ten states, mainly in the South, the percentage was over 40%, or more than two in every five people. The percentages of people with disabilities were generally lowest in the upper Midwest and Northeast; twelve states had disability percentages of less than one third for this age group (33.3%).
You can take a look at more maps like this by downloading the 2016 Disability Statistics Annual Report and the corresponding slides at www.disabilitycompendium.org/annualreport.