Introduction
New Hampshire Disability Statistics, previously known as Facts & Figures, is an annual publication of the Institute on Disability (IOD) at the University of New Hampshire. This publication describes the characteristics of people with disabilities (PWD) in New Hampshire (NH). New Hampshire Disability Statistics and its companions in the Annual Disability Statistics Collection are intended to provide a comprehensive picture of important issues related to disability in NH and the U.S.
The statistics here focus on seven topics: prevalence (all ages), disability type at state and national levels (ages 18-64), poverty (ages 18-64), education (ages 25 and older), employment (ages 18-64), private health care coverage (ages 19-64), and public health care coverage (ages 0-64). Each page of this report highlights a different topic.
State and national level statistics are estimated using data from the U.S. Census Bureau’s American Community Survey (ACS) 2021 Public Use Microdata Sample (PUMS). Statistics at the county level for NH are derived from the U.S. Census Bureau’s ACS 2017-2021 five-year estimates. Counts (i.e., the number of people) and percentages from the five-year data are reported and are to be interpreted as annual averages over the five years. For example, there was an annual average of 33,378 people with disabilities living in Rockingham County over the 2017-2021 period.
Key Findings

1 in 8 NH residents has a disability
About 1 out of every 8 New Hampshire (NH) residents reports having a disability, which includes difficulties with vision, hearing, mobility, cognition, self-care, and/or independent living. In other words, 12.1% of people living in NH report having a disability. Nationally, the disability prevalence rate is 13.0%. Below are key findings on characteristics of NH’s population with disabilities.

NH residents have lower rates of poverty
NH Adults with and without disabilities ages 18-64 experience lower rates of poverty than those in surrounding states and nationally. Of those without disabilities, 5.8% experience poverty in NH and 18.6% of PWD in NH experience poverty compared to 11.8% and 25.4% respectively at the national level. While NH poverty rates are lower than the national level, the gap between those with and without disabilities who live below the poverty line is similar.

NH residents have a higher rate of college education
NH residents have a higher rate of college education compared to national rates, including people with disabilities. In NH, 24.9% of adults ages 25 and older with disabilities have a bachelor’s degree or higher compared to 20.2% of adults with disabilities nationally. The difference in college education rates between those with and without disabilities is comparable in NH (18.4 percentage points) to the national rate (18.2 percentage points).

State employment rates are higher in NH than the U.S.
Working-age adults with disabilities in NH have higher rates of employment (46.8%) than the U.S. on average (40.7%) and compared to surrounding states. The difference in employment rate between those with and without a disability is also smaller in NH than it is nationally or in neighboring states.

Residents less likely to have private health insurance
As might be expected with lower rates of employment, NH residents with disabilities ages 19-64 are less likely to have private health insurance (56.9%) compared to those with no disability (84.4%). Just under half (49.8%) of NH residents with a disability between ages 0-64 are covered by a public health insurance program while only 15.0% for NH residents with no disability are covered by Medicaid, Medicare, or veteran’s health insurance programs.
Executive Summary
Importance of Prevalence
Knowing the number of people with a disability can demonstrate the extent to which changes to programs, accessibility of public spaces, and budgets for education and disability insurance impacts people. Secondly, knowing the population size demonstrates the voting impact of people with disabilities, and encourages those running for office to consider issues important to the disability community. Thirdly, this knowledge allows for comparisons in social, economic, and health characteristics so we can evaluate whether there are inequalities between people with and without disabilities.
Connection between poverty, education, employment, and health
Nationally, people without disabilities are almost twice as likely to have a college degree than people with disabilities. There are two primary reasons for this. One is that higher education programs may not be accessible. A second reason is that those with less education tend to be at greater risk for developing a disability later in life (Montez, Zajacova, and Hayward, 2017).
While it is generally good news that the percentage of people with a disability who have a college degree is relatively high in NH, the disparity in education between those with and without a disability is higher than the education gap at the national level. This disparity may be due to barriers such as expense, location, transportation, accessibility of buildings, availability of transition supports in high school and of independent living supports throughout the life course, and the accommodations available for PWD (Brucker, et al., 2016; Lindsay, et al., 2018). Early experiences in elementary and high school can shape an individual and family’s attitude towards higher education, which may also result in a barrier.
Disparities in employment among people with different types of disabilities overlap with barriers to education. However decreased access to educational and skill building opportunities for jobs in their community can be a barrier to employment, as is the availability of independent living and job supports, and stereotyping of PWD by potential employers (Sevak, et al., 2018; Brucker, et al., 2016; Erickson, et al., 2013). Finding ways to dismantle these barriers to boost employment is critical to both general and mental health of PWD (Reichard, et al., 2018).
Understanding the education gap in relation to types of employment of PWD can lead us to understanding potential health outcomes. Interestingly, while employment is a positive input in the lives of PWD that boosts general and mental health, those with disabilities who work frequently forgo necessary healthcare (Reichard, et al., 2018). While PWD generally have health insurance, whether public or private, addressing the nuances of utilizing the insurance may increase healthcare accessibility.
Understanding the interconnectedness of this information can help leaders and lawmakers develop policies to expand access to education, employment, and healthcare.
Over 166,000 or nearly 1 out of 8 New Hampshire residents has a disability. This is just under the national average. This information shows how many people may be affected by changes in state laws or services related to disability. It helps to make the needs of people with disabilities more visible to lawmakers.
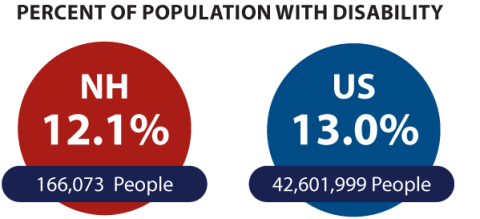
Population and percent of total population of persons with and without disabilities in US and New England states
| Prevalence | US | NH | ME | MA | VT |
|---|---|---|---|---|---|
| Total Population | 326,942,778 | 1,373,423 | 1,358,182 | 6,915,688 | 638,559 |
| Population with Disability | 42,601,999 | 166,073 | 210,432 | 808,474 | 85,969 |
| Percent | 13.0% | 12.1% | 15.5% | 11.7% | 13.5% |
Population and percent of total population of persons with disabilities in NH by county
| County | Population | Total with Disability | Percent |
|---|---|---|---|
| Belknap | 62,689 | 10,308 | 16.4% |
| Carroll | 49,609 | 7,930 | 16.0% |
| Cheshire | 75,763 | 10,337 | 13.6% |
| Coos | 29,490 | 6,225 | 21.1% |
| Grafton | 90,132 | 12,035 | 13.4% |
| Hillsborough | 416,649 | 48,529 | 11.6% |
| Merrimack | 149,690 | 20,543 | 13.7% |
| Rockingham | 310,459 | 33,378 | 10.8% |
| Strafford | 129,024 | 16,574 | 12.8% |
| Sullivan | 42,644 | 5,979 | 14.0% |
Why is there geographic variation? Some age groups have substantially higher rates of disability than others. For instance, children have low rates of disability, while seniors have higher rates. In geographic areas with a higher concentration of older residents, we tend to see higher prevalence of disability (Paul, et al., 2023). We also see geographic differences in disability program participation. In addition to differences in age, this may be due to differences in the availability of employment opportunities for people with disabilities (Gettens, et al., 2018).
The poverty rate in New Hampshire is lower for both people with and without disabilities than in surrounding states and nationally. In NH, nearly one in six people with disabilities (18.6%) experience poverty while nationally one in four people with disabilities (25.4%) experiences poverty.
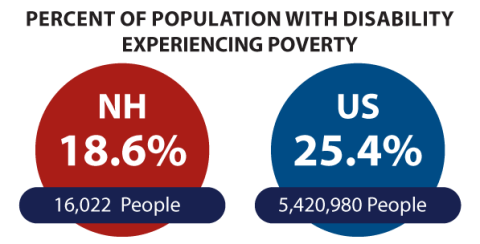
Percent of populations of persons with and without disabilities in US and New England states who experience poverty (Age 18-64)
| Poverty | US | NH | ME | MA | VT |
|---|---|---|---|---|---|
| Percent of Pop. with Disability Experiencing Poverty | 25.4% | 18.6% | 34.1% | 26.4% | 35.5% |
| Percent of Pop. without Disability Experiencing Poverty | 11.8% | 5.8% | 10.9% | 11.6% | 13.0% |
| Poverty Gap | 13.6% points | 12.8% points | 23.2% points | 14.8% points | 22.5% points |
| Total Population with Disability Experiencing Poverty | 5,420,980 | 16,022 | 37,853 | 102,885 | 15,631 |
Percent of populations of persons with and without disabilities who experience poverty (Age 18-64) in NH by county
| County | Percent of People with Disability (Age 18-64) | Percent of People without Disability (Age 18-64) |
|---|---|---|
| Belknap | 20.7% | 5.8% |
| Carroll | 18.8% | 6.4% |
| Cheshire | 21.9% | 8.4% |
| Coos | 26.0% | 7.1% |
| Grafton | 23.0% | 6.9% |
| Hillsborough | 19.7% | 5.2% |
| Merrimack | 20.0% | 5.0% |
| Rockingham | 15.0% | 3.5% |
| Strafford | 24.5% | 7.7% |
| Sullivan | 28.7% | 11.0% |
Slightly more people in NH have a bachelor’s degree compared to most other states. This includes people with disabilities: Of those aged 25 and older, 24.9% of NH residents with a disability have a college degree compared to 20.2% nationwide. In other words, one out of four New Hampshire adults with a disability has a bachelor’s degree. This is a little better than the national average where 1 in 5 adults with a disability has a bachelor’s degree or higher.
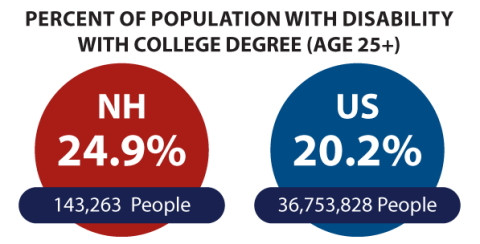
Population with and without Disability with College Degree (25+)
| Population (Age 25+) with College Degree | US | NH | ME | MA | VT |
|---|---|---|---|---|---|
| Percent of Pop. with Disability | 20.2% | 24.9% | 20.7% | 25.5% | 29.2% |
| Percent of Pop. without Disability | 38.4% | 43.3% | 39.7% | 46.9% | 47.8% |
| Education Gap | 18.2% points | 18.4% points | 19.0% points | 21.4% points | 18.6% points |
| Total Population of People w/Disability | 36,753,828 | 143,263 | 183,887 | 699,114 | 74,830 |
Population with and without Disability with College Degree (25+) in NH by county
Please note that (*) indicates that the sample size of the data available was too small to make an estimate.
| County | Percent of People with Disability (Age 25+) | Percent of People without Disability (Age 25+) | Education Gap |
|---|---|---|---|
| Belknap | 21.1% | 34.1% | 13.0% points |
| Carroll | 27.8% | 39.8% | 12.0% points |
| Cheshire | 22.3% | 35.5% | 13.2% points |
| Coos | *sample too small | *sample too small | *sample too small |
| Grafton | 23.3% | 46.9% | 23.6% points |
| Hillsborough | 22.5% | 42.8% | 20.3% points |
| Merrimack | 19.7% | 39.9% | 20.2% points |
| Rockingham | 24.7% | 45.6% | 20.9% points |
| Strafford | 19.7% | 40.8% | 21.1% points |
| Sullivan | *sample too small | *sample too small | *sample too small |
NH residents with a disability are more likely to be working compared to the national average and to our neighboring states. In New Hampshire 46.8% of adults with a disability have a job - this is a little higher than the national average. Meanwhile, 81.7% of people without a disability have a job, resulting in an employment gap of 34.9 percentage points. The numbers presented here are only for those ages 18 to 64, the “working-age population”.

Population with and without Disability Employed (Age 18-64)
| Population (Age 18-64) | US | NH | ME | MA | VT |
|---|---|---|---|---|---|
| Percent of Pop. with Disability | 40.7% | 46.8% | 35.8% | 41.7% | 37.9% |
| Percent of Pop. without Disability | 76.6% | 81.7% | 80.1% | 78.8% | 79.3% |
| Employment Gap | 35.9% points | 34.9% points | 44.3% points | 37.1% points | 41.4% points |
Population with and without Disability Employed (Age 18-64) in NH by county
| County | Percent of People with Disability (Age 18-64) | Percent of People without Disability (Age 18-64) | Employment Gap |
|---|---|---|---|
| Belknap | 41.1% | 82.7% | 41.6% points |
| Carroll | 52.1% | 80.6% | 28.5% points |
| Cheshire | 43.8% | 80.2% | 36.4% points |
| Coos | 36.1% | 82.4% | 46.3% points |
| Grafton | 41.7% | 76.7% | 35.0% points |
| Hillsborough | 46.3% | 84.0% | 37.7% points |
| Merrimack | 45.4% | 82.6% | 37.2% points |
| Rockingham | 44.1% | 84.6% | 40.5% points |
| Strafford | 47.8% | 80.9% | 33.1% points |
| Sullivan | 30.1% | 77.0% | 46.9% points |
Interested in national employment trends for people with disabilities? For further research and resources on the national trends for people with disabilities
visit researchondisability.org.
This section identifies the number of people aged 19 to 64 who have private health insurance. Private health insurance is often tied to having a job. 56.9% of New Hampshire adults with a disability have private health insurance, a little higher than the national average of 48.3%. Of adults in New Hampshire without disabilities, 84.4% have private health insurance, nationally that rate is 75.6%. This shows people without disabilities have less access to private health insurance.
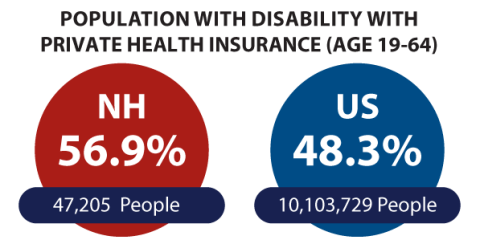
Population with and without Disability with Private Health Insurance (Age 19-64)
| Population (Age 19-64) | US | NH | ME | MA | VT |
|---|---|---|---|---|---|
| Percent of Pop. with Disability | 48.3% | 56.9% | 44.0% | 48.7% | 46.1% |
| Percent of Pop. without Disability | 75.6% | 84.4% | 80.7% | 81.2% | 79.5% |
| Private Insurance Gap | 27.3% points | 27.5% points | 36.7% points | 32.5% points | 33.4% points |
Population with and without Disability with Private Health Insurance (Age 19-64) in NH by county
| County | Percent of People with Disability (Age 18-64) | Percent of People without Disability (Age 18-64) | Private Insurance Gap |
|---|---|---|---|
| Belknap | 48.5% | 80.1% | 31.6% points |
| Carroll | 55.0% | 75.4% | 20.4% points |
| Cheshire | 49.4% | 82.2% | 39.1% points |
| Coos | 34.1% | 69.5% | 35.4% points |
| Grafton | 49.1% | 80.7% | 27.8% points |
| Hillsborough | 51.4% | 84.9% | 29.6% points |
| Merrimack | 52.7% | 83.8% | 34.2% points |
| Rockingham | 62.8% | 87.9% | 22.0% points |
| Strafford | 55.3% | 85.4% | 27.0% points |
| Sullivan | 35.1% | 77.0% | 41.9% points |
Public health insurance (PHI) includes Medicaid, Medicare, and veteran's health insurance programs. In New Hampshire, 49.8% of people under age 64 with disabilities have public health insurance compared to the national average of 53.5%. Those without disabilities in NH have substantially lower rates of PHI enrollment (15.0%) compared to the U.S. total (22.1%).
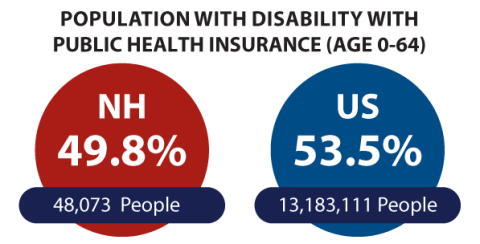
Population with and without Disability with Public Health Insurance (Age 0-64)
| Population (Age 0-64) | US | NH | ME | MA | VT |
|---|---|---|---|---|---|
| Percent of Pop. with Disability | 53.5% | 49.8% | 60.3% | 59.4% | 62.0% |
| Percent of Pop. without Disability | 22.1% | 15.0% | 19.7% | 22.8% | 24.0% |
| Public Insurance Gap | 31.4% points | 34.8% points | 40.6% points | 36.6% points | 38.0% points |
Population with and without Disability with Private Health Insurance (Age 0-64) in NH by county
| County | Percent of People with Disability (Age 0-64) | Percent of People without Disability (Age 0-64) | Public Insurance Gap |
|---|---|---|---|
| Belknap | 56.8% | 18.7% | 38.1% points |
| Carroll | 48.7% | 24.1% | 24.6% points |
| Cheshire | 51.5% | 16.5% | 35.0% points |
| Coos | 70.6% | 26.6% | 44.0% points |
| Grafton | 55.8% | 17.2% | 39.5% points |
| Hillsborough | 51.6% | 13.7% | 37.9% points |
| Merrimack | 52.7% | 7.6% | 38.6% points |
| Rockingham | 58.3% | 10.0% | 48.3% points |
| Strafford | 55.0% | 14.4% | 40.6% points |
| Sullivan | 38.7% | 19.9% | 18.8% points |
References
- Brucker, D., Houtenville, A., and Lauer, E. (2016). Using sensory, functional, and activity limitation data to estimate employment outcomes for working-age persons with disabilities in the United States. Journal of Disability Policy Studies, 27(3), 131-137.
- Erickson, W.A., von Schrader, S., and Bruyere, S.M. (2014). The employment environment: Employer perspectives, policies, and practices regarding the employment of persons with disabilities. Rehabilitation Counseling Bulleting, 57(4).
- Gettens, J., Lei, P-P, and Henry, A.D. (2018). Accounting for geographic variation in disability program participation. Social Security Bulletin, 78(2). https://www.ssa.gov/policy/docs/ssb/v78n2/v78n2p29.html
- Paul, S., Rogers, S., Bach, S., & Houtenville, A.J. (2023). Annual Disability Statistics Compendium: 2023. Durham, NH: University of New Hampshire, Institute on Disability.
- Lindsay, S., Cagliostro, E., and Carafa, G. 2018. A systematic review of barriers and facilitators of disability disclosure and accommodations for youth in post-secondary education. International Journal of Disability, Development and Education, 65(5), 526-556.
- Montez, J.K., Zajacova, A., and Hayward, M.D. 2017. Disparities in disability by educational attainment across US States. American Journal of Public Health, 107(7), 1101-1108.
- Reichard, A. Stransky, M., Brucker, D., and Houtenville, A. (2019). The relationship between employment and health and health care among working-age adults with and without disabilities in the United States. Disability and Rehabilitation, 41(19).
- Sevak, P., O’Neill, J., Houtenville, A., and Brucker, D. (2018) State and local determinants of employment outcomes among individuals with disabilities. Journal of Disability Policy Studies, 29(2), 119-128.
Acknowledgments
Special thanks to the following individuals who have contributed to the success of this effort: Kelly Nye-Lengerman, Romy Eberle, and Douglas Marino.
Funding for this publication is made possible by the NH Department of Health and Human Services, Bureau of Developmental Services and the University of New Hampshire, Rehabilitation Research and Training Center on Disability Statistics and Demographics (StatsRRTC). The StatsRRTC is funded by the U.S. Department of Health and Human Services Administration for Community Living National Institute on Disability, Independent Living, and Rehabilitation Research (NIDILRR), grant number 90RT5037-03-00. The information developed by the StatsRRTC does not necessarily represent the policies of the Department of Health and Human Services, and you should not assume endorsement by the Federal Government (Edgar, 75.620 (b)).
This publication is supported, in part, by Grant #90DDUC01050100 from the Administration on Intellectual and Developmental Disabilities, US Department of Health and Human Services (HHS), to the Institute on Disability.
Suggested Citation
Bach, S., Henly, M., & Houtenville, A. (2023). Facts & Figures: The 2023 Report on Disability in New Hampshire. Durham, NH: University of New Hampshire, Institute on Disability.
About the Institute on Disability
The Institute on Disability (IOD) was established in 1987 to provide a university-based focus for the improvement of knowledge, policies, and practices related to the lives of people with disabilities and their families and is New Hampshire’s University Center for Excellence in Developmental Disabilities (UCEDD). Located within the University of New Hampshire, the IOD is a federally designated center authorized by the Developmental Disabilities Act. Through innovative and interdisciplinary research, academic, service, and dissemination initiatives, the IOD builds local, state, and national capacities to respond to the needs of individuals with disabilities and their families.
For more information, please explore our website.
This document is available in alternative formats upon request.
No part of this copyrighted work may be modified, reproduced, or used in any form or by any means – graphic, electronic, or mechanical, including photocopying, recording, taping, web distribution, or information storage and retrieval systems – without the written permission of the UNH Institute on Disability. For permission, please .
