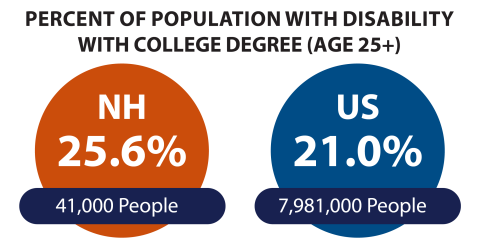
Population with and without Disability with Bachelor's Degree or higher (25+) by State
| Population (Age 25+) with Bachelor's Degree or Higher | US | NH | ME | MA | VT |
|---|---|---|---|---|---|
| Percent of Pop. with Disability | 21.0% | 25.6% | 22.10% | 25.00% | 26.30% |
| Percent of Pop. without Disability | 39.1% | 44.6% | 39.70% | 50.90% | 48.30% |
| Education Gap | 18.1 | 19.0 | 17.6 | 25.9 | 22.0 |
| Total Pop. with Disability AND Bachelor's Degree | 7,981,000 | 41,000 | 42,000 | 187,000 | 21,000 |
| Total Pop. of People Ages 25+ with a Disability | 38,005,000 | 160,000 | 190,000 | 747,000 | 81,000 |
Population with and without Disability with Bachelor's Degree (25+) in NH by county
Please note that (*) indicates that the sample size of the data available was too small to make an estimate.
| County | Percent of People with Disability (Age 25+) | Percent of People without Disability (Age 25+) | Education Gap |
|---|---|---|---|
| Belknap | 22.3% | 34.8% | 12.5 |
| Carroll | 27.5% | 40.1% | 12.6 |
| Cheshire | 24.60% | 36.70% | 12.1 |
| Coos | *sample too small | *sample too small | n/a |
| Grafton | 25.10% | 47.50% | 22.4 |
| Hillsborough | 24.30% | 43.10% | 18.8 |
| Merrimack | 20.40% | 41.00% | 20.6 |
| Rockingham | 25.40% | 46.40% | 21.0 |
| Strafford | 20.40% | 42.90% | 22.5 |
| Sullivan | *sample too small | *sample too small | n/a |