Data Report to Inform Programs and Policies
Yang, L., Armenti, K., Thomas, N., NH OHSP
Published: 2/28/2024
Acknowledgements: NH Division of Public Health Services, Department of Health and Human Services, Bureau of Public Health Statistics and Informatics
Executive Summary
This report contains data and information on occupational injuries and illnesses in New Hampshire, which marks an important step on the path to a safer and healthier work environment for New Hampshire workers. The report format used is based on the Council of State and Territorial Epidemiologists (CSTE) and the National Institute for Occupational Safety and Health—Centers for Disease Control and Prevention (NIOSH-CDC) “Occupational Health Indicators: A Guide for Tracking Occupational Health Conditions and Their Determinants.”1 This guide was produced by the NIOSH-States Occupational Health Surveillance Work Group, which was created to make recommendations to NIOSH concerning fundamental State-based surveillance activities, beginning with recommendations to identify occupational injuries, illnesses, and hazards to be placed under surveillance by states. The resulting occupational health indicators have been utilized by many states to produce state occupational health surveillance reports. Using the above framework, this report includes available New Hampshire data on many of the established occupational health injury and illness indicators, as well as indicators specific to New Hampshire’s working population. Because New Hampshire does not participate in the Bureau of Labor Statistics Survey of Occupational Injury and Illness (SOII), we are unable to report on those indicators. The numbered indicators are aligned with the appropriate indicators in the CSTE/ NIOSH Guide. These indicators illustrate the importance of collecting occupational health injury and illness data to inform prevention efforts aimed at eliminating or reducing work-related events.
What is an Occupational Health Indicator? An occupational health indicator is a specific measure of work-related disease or injury, or a factor associated with occupational health such as workplace exposures, hazards, or interventions, in a specified population. These indicators can be generated by states to track trends in the occupational health status of the working population.
NH Report Highlights
- Unemployment increased during the COVID-19 pandemic: The unemployed workforce increased from 2.6% in 2019 to 6.6% in 2020.
- Less than 40-hour work weeks: NH workers were more likely to be less than 40 hours per week, increasing from 33.1% 2019 to 37.1% in 2020.
- From 2000 to 2019 there were 295 work-related fatalities in NH, with 14 occurring in 2020.
- 200+ work-related hospitalizations: There are over 200 work-related hospitalizations per year determined to be payable by Workers’ Compensation.
- High risk for morbidity in industry: In 2020, one in twenty NH workers were employed in industries at high risk for morbidity.
- High risk for morbidity in occupation: In 2020, one in seven NH workers were employed in occupations at high risk for morbidity.
Introduction/Demographics
Occupational health indicators can provide information about a population’s health status with respect to workplace injuries and illnesses or to factors that can influence health. These indicators can either be measures of health (work-related disease or injury) or factors associated with health, such as workplace exposures, hazards or interventions, and socioeconomic impact.
The indicators represent a core set of data that, if collected at the state level, would assist in the development of programs to prevent workplace injuries and illnesses. While analyzing these core data points is part of a fundamental surveillance program, it is expected that states use them in conjunction with other guidelines for state-based surveillance and as a complement to overall state and national goals to improve the health of the population.
The occupational health indicators are estimated from many data sources. They are meant to provide an overview and general assessment of the occupational health status of New Hampshire workers over a span of years for which data are available. Each data source has its strengths and limitations. This report includes a State Employment Profile and many of the core occupational health indicators for New Hampshire based on the most recent data available for each indicator. No single data source is currently adequate to characterize occupational health profiles in the State.
| Indicator | 2008 | 2018 | 2019 | 2020 |
|---|---|---|---|---|
| Total number of employed persons 16 years or older[1] | 712,000 | 745,000 | 756,000 | 704,000 |
| Percentage of workforce unemployed[1] | 3.8% | 2.6% | 2.6% | 6.6% |
| Percentage of employment self-employed[1] | 7.6% | 7.1% | 6.6% | 6.4% |
| Percentage of employment in part-time jobs[1] | 19.9% | 18.3% | 18.8% | 17.3% |
| Percentage of employment by number of hours worked per week[1]: <40 hours | 33.8% | 29.5% | 33.1% | 37.1% |
| Percentage of employment by number of hours worked per week[1]: 40 hours | 33.3% | 38.1% | 38.6% | 38.9% |
| Percentage of employment by number of hours worked per week[1]: 41+ hours | 28.5% | 28.7% | 28.3% | 24.0% |
| Percentage of employment by sex[1]: Males | 52.5% | 53.1% | 53.1% | 52.7% |
| Percentage of employment by sex[1]: Females | 47.5% | 46.9% | 46.8% | 47.3% |
| Percentage of employment by age group[1][3]: 16 to 17 | 2.1% | 1.9% | 1.7% | 1.8% |
| Percentage of employment by age group[1][3]: 18 to 64 | 93.9% | 90.4% | 91.2% | 90.5% |
| Percentage of employment by age group[1][3]: 65+ | 3.9% | 7.7% | 7.0% | 7.7% |
| Percentage of employment by race[1]: White | 95.9% | 93.8% | 94.0% | 94.0% |
| Percentage of employment by race[1]: Black | 1.1% | 1.2% | 1.7% | 2.0% |
| Percentage of employment by race[1]: Other | 2.9% | 5.0% | 4.2% | 4.0% |
| Percentage of employment by industry[1]: Agriculture and Related | 0.8% | 0.6% | 0.6% | 0.9% |
| Percentage of employment by industry[1]: Construction | 7.4% | 8.2% | 8.3% | 7.7% |
| Percentage of employment by industry[1]: Education and Health Services | 21.9% | 23.5% | 23.4% | 24.1% |
| Percentage of employment by industry[1]: Financial Activities | 6.7% | 6.1% | 6.6% | 6.9% |
| Percentage of employment by industry[1]: Information | 2.7% | 2.0% | 1.7% | 2.1% |
| Percentage of employment by industry[1]: Leisure and Hospitality | 8.0% | 8.4% | 8.7% | 7.1% |
| Percentage of employment by industry[1]: Manufacturing Durable goods | 10.6% | 10.4% | 10.5% | 10.8% |
| Percentage of employment by industry[1]: Manufacturing Non-durable goods | 3.2% | 3.1% | 3.4% | 3.1% |
| Percentage of employment by industry[1]: Mining | 0.1% | 0.0% | 0.1% | 0.0% |
| Percentage of employment by industry[1]: Other Services | 4.3% | 4.2% | 4.4% | 3.7% |
| Percentage of employment by industry[1]: Professional and Business Services | 10.6% | 12.3% | 11.8% | 12.2% |
| Percentage of employment by industry[1]: Public Administration | 4.6% | 3.9% | 3.8% | 4.2% |
| Percentage of employment by industry[1]: Transportation and Utilities | 3.9% | 3.8% | 3.9% | 3.9% |
| Percentage of employment by industry[1]: Wholesale and Retail Trade | 15.3% | 13.5% | 12.9% | 13.4% |
| Percentage of employment by occupation[1]: Construction and Extraction | 5.6% | 5.7% | 5.1% | 4.7% |
| Percentage of employment by occupation[1]: Farming, Fishing, and Forestry | 0.4% | 0.2% | 0.2% | 0.5% |
| Percentage of employment by occupation[1]: Installation, Maintenance, and Repair | 3.6% | 2.8% | 2.9% | 2.8% |
| Percentage of employment by occupation[1]: Management, Business, and Financial Operations | 16.8% | 18.2% | 19.1% | 19.7% |
| Percentage of employment by occupation[1]: Office and Administrative Support | 13.6% | 10.2% | 11.2% | 10.7% |
| Percentage of employment by occupation[1]: Production | 6.6% | 7.0% | 6.4% | 6.3% |
| Percentage of employment by occupation[1]: Professional and Related Occupations | 23.4% | 25.2% | 24.5% | 25.1% |
| Percentage of employment by occupation[1]: Sales and Related Occupations | 10.9% | 10.2% | 10.1% | 9.7% |
| Percentage of employment by occupation[1]: Service | 14.6% | 16.0% | 15.9% | 14.6% |
| Percentage of employment by occupation[1]: Transportation and Material Moving | 4.6% | 4.6% | 4.6% | 6.0% |
Data Sources: [1] BLS Geographic Profiles of Employment and Unemployment [2] NIOSH Employed Labor Force query system (for percentage of civilian employment by sex, age, race, and Hispanic origin)
Occupational Health Indicators for New Hampshire
Indicator 2: Work-Related Hospitalizations (NH Hospital Data)
Introduction
More severe occupational injuries and illnesses may result in hospitalization. Since hospital discharge data are categorized by payer, it is possible to limit the data to just those patients whose discharges were billed to the state workers’ compensation system. However, work-related hospitalizations are under-represented due to utilization of other payer sources (out-of-pocket or patient’s private insurance, for example).2
Calculation
- Definition: Annual number of inpatient hospitalizations for persons age 16 years and older; Annual crude rate of inpatient hospitalizations per 100,000 employed persons age 16 and older.
- Numerator: Inpatient hospital discharges with primary payer coded as workers’ compensation excludes NH residents hospitalized out of state. Not age adjusted.
- Denominator: Employed persons age 16 years or older for the same calendar year.
- Data Sources:
- Hospitalization Data: NH Inpatient Hospital Discharge Data.
- Employment Data: BLS Geographic Profiles of Employment and Unemployment
Data
From 2012 to 2020, the average raw count of work-related hospitalizations was 247 with an expected range ± 46 with 95% confidence. Between 2012 and 2020, hospitalizations ranged from a low of 203 in 2015 to a high of 288 in 2018.
Table 2. Number of Work-Related Hospitalizations, New Hampshire, 2012-2020
| Year | Work-Related Hospitalizations |
|---|---|
| 2012 | 242 |
| 2013 | 263 |
| 2014 | 235 |
| 2015 | 203 |
| 2016 | 242 |
| 2017 | 262 |
| 2018 | 288 |
| 2019 | 253 |
| 2020 | 235 |
Figure 1. Work-Related Hospitalizations, 2012-2020
Rate Per 100,000 Employees Ages 16+

There was yearly variation in the number of hospitalizations, the rate per 100,000 employees age 16+ was relatively stable between 2012 and 2020.
Discussion
Individuals hospitalized with work-related injuries and illnesses have some of the more serious and costly work-related adverse health outcomes. Documenting the burden of occupational injuries and illnesses that require hospitalization over time offers the opportunity to identify workers that continue to be at high risk and to target and evaluate the impact of prevention efforts over time.
Indicator 3: Fatal Work-Related Injuries
Introduction
One work related death is too many, and yet multiple New Hampshire workers die each year from injuries received at work. Data tracking the number of workplace deaths is from the Census of Fatal Occupational Injuries (CFOI) administered by the Bureau of Labor Statistics. CFOI gathers data for all states and is a reliable count (not estimate) of all traumatic injury deaths related to work.
Calculation
- Definition: Annual number of fatal work-related injuries; annual crude fatality rate per 100,000 full-time equivalent workers (FTEs) aged 16 years and older
- Numerator: Fatal work-related injuries reported to the Census of Fatal Occupational Injuries (CFOI)
- Denominator: Full time equivalent workers based on total hours worked for all employees
- Data Sources:
Data
From 2012 to 2020, the average raw count of work-related fatalities was 14 with an expected range ± 9 with 95% confidence. The rate per 100,000 employees ages 16+ has jumped year to year from a high of 3.2 in 2016 to 2.2 in 2020.
Table 3. New Hampshire Fatal Work Injuries, 2012-2020
| Year | Fatal Work Injuries |
|---|---|
| 2012 | 14 |
| 2013 | 14 |
| 2014 | 17 |
| 2015 | 18 |
| 2016 | 22 |
| 2017 | 11 |
| 2018 | 20 |
| 2019 | 11 |
| 2020 | 14 |
figure 2. NH fatal work injuries 2012-2020
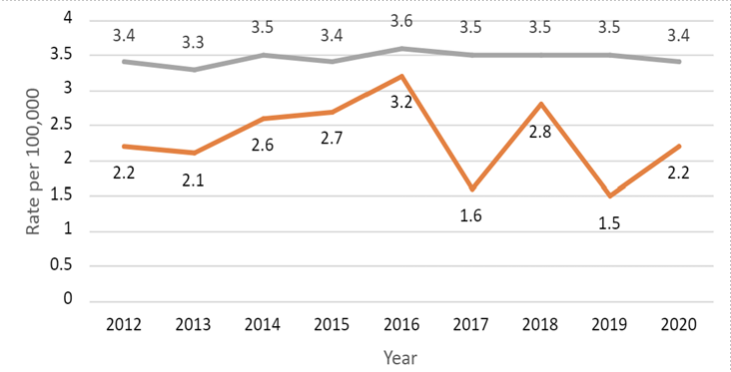
Key: (Gray: US, Orange: NH)
Discussion
Multiple risks contribute to work-related fatalities, including worker characteristics, industry, occupation, and activity at time of incident. Surveillance of work-related fatalities can identify emerging hazards and can lead to the development of new interventions and new or revised regulations to protect workers.
Indicator 6: Hospitalizations for Work-Related Burns
Introduction
Work-related burns are not only extremely painful but also result in large amounts of lost work time. Hospital discharge data are useful to estimate the number of hospitalized burns in New Hampshire. Cases are identified by using standard diagnosis codes for burns with those injuries where the expected payer is workers’ compensation.
Calculation
- Definition: Annual crude rate per 100,000 employed persons age 16 and older. Excludes: unknown age, and sequelae and subsequent encounters.
- Numerator: Hospital discharges with primary diagnosis of burn injury (ICD-9 code between 940 and 94999 and ICD10-CM T20-T25, T26-T28, T30-T32) and with primary payer coded as workers’ compensation. Includes NH residents hospitalized out of state. Not age adjusted.
- Denominator: Employed persons age 16 years or older for the same calendar year
- Data Sources:
- Hospitalizations: NH Inpatient Hospital Discharge Data.
- Employment Data: BLS Geographic Profiles of Employment and Unemployment
Data
Due to the method of collection, many New Hampshire work-related burn inpatient hospitalizations are not included here. In collection, out-of-state residents are excluded, and out-of-state inpatient hospitalizations are excluded. The nearest Burn Center is Brigham and Women’s Hospital Burn Center in Boston, Massachusetts. Therefore, since many severe hospitalizations are out of state, these are excluded from the counts below. This has been noted as a potential opportunity for improvement in the collection of this indicator.
Table 4. Number of Work-Related Burn Hospitalizations, New Hampshire, 2012-2020
| Year | Total |
|---|---|
| 2012 | 5 |
| 2013 | 3 |
| 2014 | 5 |
| 2015 | 13 |
| 2016 | 8 |
| 2017 | 12 |
| 2018 | 12 |
| 2019 | 3 |
| 2020 | 10 |
Discussion
Work-related burns are some of the most devastating injuries affecting workers. Burns are, in fact, the most common cause of work-related hospitalization for young workers. Although burns requiring hospitalization are unusual events, they are painful, disabling, and generally expensive to treat. Surveillance of work-related burns is crucial to the recognition and prevention of these conditions. Occupational burn injuries are preventable with appropriate education, worker training, personal protective equipment (PPE), engineering and administrative controls, and safe work practices. Development of new prevention methods for these injuries, as well as evaluation of new intervention measures, could be possible with the information gathered by this indicator.
Indicators 9 and 10: Pneumoconiosis Hospitalizations and Mortality
Introduction
Pneumoconiosis refers to a group of interstitial lung diseases caused by the inhalation of certain dusts, including asbestos, silica, and coal dust. The principal cause of any type of pneumoconiosis is work-place exposure, often taking many years to develop and be manifested, although in some cases – silicosis, particularly – rapidly progressive forms can occur after only short periods of intense exposure. When severe, the diseases often lead to lung impairment, disability, and premature death. From a public health perspective, these conditions are entirely man-made, and can be avoided through appropriate dust control.3
Unlike some of the other occupational health indicators based on hospital discharge data, work-relatedness for pneumoconiosis is not identified based on workers’ compensation being the expected payer for hospital services. Instead, this indicator assumes most pneumoconiosis are work-related. For this reason, it may not accurately reflect recent respiratory exposures in the state. Because pneumoconioses are typically diseases of long latency, it may be many years before exposures lead to a hospitalization or death. Likewise, it may be years before changes in occupational exposures affect the number of cases.
Indicator 9 Calculation
- Numerators: All Hospital Discharges with primary or contributing (secondary) diagnosis of the following:
- Total Pneumoconiosis, ICD-9 Code = 500.0 through 505.9 and ICD-10-CM = J60 through J66.
- Coal workers’ pneumoconiosis, ICD-9 Code = 500 and ICD-10-CM = J60.
- Asbestosis, ICD-9 Code = 501 and ICD-10- CM = J61.
- Silicosis, ICD-9 Code = 502 and ICD-10-CM = J62.
- Other and Unspecified pneumoconiosis, ICD-9 Codes = 503 through 505.99 and ICD-10-CM = J63 through J66.
- Denominator: Resident population age 15 years and older per calendar year
- Data Sources: Hospitalizations: NH Emergency Department and Inpatient Hospital Discharge Data
| Year | Total | Inpatient coal workers' pneumoconiosis | Inpatient asbestosis | Inpatient silicosis | Inpatient other and unspecified pneumoconiosis |
|---|---|---|---|---|---|
| 2012 | 90 | 1 | 80 | 7 | 2 |
| 2013 | 82 | 5 | 73 | 4 | 0 |
| 2014 | 100 | 3 | 91 | 7 | 1 |
| 2015 | 95 | 4 | 85 | 4 | 2 |
| 2016 | 68 | 1 | 64 | 2 | 1 |
| 2017 | 63 | 1 | 59 | 3 | 0 |
| 2018 | 56 | 0 | 54 | 1 | 1 |
| 2019 | 57 | 3 | 50 | 3 | 1 |
| 2020 | 52 | 0 | 51 | 1 | 0 |

Indicator 10 Calculation
- Definition: Annual number of deaths; Annual death rate (deaths per million residents); Annual age-standardized death rate (standardized by the direct method to the Year 2000 U.S. Standard population) (deaths per million residents)
- Numerator: Deaths with ICD10 Codes between J60 and J66.8
- Deaths with ICD-10 code of J60-J66 (ICD-9 code 500-505) as the underlying or contributing cause of death (“total pneumoconiosis”)
- Deaths with ICD-10 code of J60 (ICD9 code 500) as the underlying or contributing cause of death (“coal workers’ pneumoconiosis”)
- Deaths with ICD-10 code of J61 (ICD9 code 501) as the underlying or contributing cause of death (“asbestosis”)
- Deaths with ICD-10 code of J62 (ICD9 code 502) as the underlying or contributing cause of death (“silicosis”)
- Deaths with ICD-10 code in the range J63 – J66 (ICD-9 code range 503 – 505) (“other and unspecified pneumoconiosis”)
- Denominator: Resident population age 15 years and older per calendar year
- Data Sources:
- NH Vital Records, Death Certificate Data
- State population estimates from the U.S. Bureau of the Census American Community Survey
Indicator 10 Data
| Year | Total |
|---|---|
| 2012 | 5 |
| 2013 | 3 |
| 2014 | 5 |
| 2015 | 13 |
| 2016 | 8 |
| 2017 | 12 |
| 2018 | 12 |
| 2019 | 3 |
| 2020 | 10 |
Discussion
Pneumoconiosis is largely determined by local industrial activities. Historically, New Hampshire’s industries that have contributed to these diseases of the lung include, mining (silica primarily), automotive (primarily brakes), construction (milling, sawing, sandblasting, etc), and shipbuilding (primarily use of asbestos). Although the use of asbestos and asbestos products has dramatically decreased in recent years, they are still found in many residential and commercial settings and continue to pose a health risk to workers and others.
Control of occupational dust exposure is the single most effective means of preventing pneumoconiosis. Tracking of pneumoconiosis is essential for measuring progress towards elimination of the disease, as well as for targeting prevention and disease management programs.
Indicators 11: Acute Work-Related Pesticide-Associated Illness and Injury Reported to Poison Control Centers
Introduction
Workers who handle pesticides are at increased risk for exposure. Data on acute poisonings and chemical exposures are useful to target prevention.
Calculation
- Definition: Annual number of reported cases of work-related pesticide poisoning; Annual incidence rate of reported cases of work-related pesticide poisoning per 100,000 employed persons age 16 years or older
- Numerator: Reported cases of work-related pesticide poisoning
- Denominator: Employed persons age 16 years and older for the same calendar year
- Note: Counts lower than 10 events do not produce statistically reliable rates
- Data Sources:
- Poison Control Center Data
- BLS Geographic Profiles of Employment and Unemployment
Data
| Year | Total |
|---|---|
| 2012 | 16 |
| 2013 | 12 |
| 2014 | 11 |
| 2015 | 21 |
| 2016 | 9 |
| 2017 | 17 |
Discussion
Pesticide poisoning is an important occupational health issue because pesticides are used in a large number of industries, which puts many different categories of workers at risk. While the majority of its uses are accounted for in agriculture, workers in other industries are at risk for exposure as well, including commercial applicators of pesticides for pest-control (and workers in pest-controlled buildings, such as teachers), retail workers (due to the availability of commercial pesticides), emergency responders such as fire-fighters and police officers (because they are often the first responders to emergency events and may be unaware of the presence of a poisoning hazard), and aircraft personnel (including flight attendants) due to use of pesticides for insect and disease control. Tracking pesticide illness informs intervention efforts targeted toward better prevention strategies to protect many worker groups.
Indicator 12: Incidence of Malignant Mesothelioma
Introduction
Malignant mesothelioma, while relatively rare, is a fatal cancer largely attributable to workplace exposures to asbestos. Tracking malignant mesothelioma should be undertaken to document the burden of occupational disease, to design, target, and evaluate the impact of prevention efforts over time, and to identify previously unrecognized settings in which workers may continue to be at risk of asbestos exposure.
Calculation
- Definition: Annual number of incident mesothelioma cases, Annual mesothelioma incidence rate (cases per million residents), and Annual, age standardized, mesothelioma incidence rate (standardized by the direct method to the Year 2000 U.S. Standard population) (cases per million residents)
- Numerator: Incident Cases with Mesothelioma (from the New Hampshire Cancer Registry)
- Denominator: Resident population age 15 years and older per calendar year
- Data Sources:
- State-wide Cancer Registry Data, 2012-2020
- State population estimates from the U.S. Bureau of the Census American Community Survey
Data
From 2012 to 2020, the average incidence of malignant mesothelioma was 16 with an expected range ± 9 with 95% confidence.
| Year | Total |
|---|---|
| 2012 | 16 |
| 2013 | 14 |
| 2014 | 20 |
| 2015 | 18 |
| 2016 | 11 |
| 2017 | 20 |
| 2018 | 24 |
| 2019 | 12 |
| 2020 | 17 |

Discussion
Incidence of mesothelioma has been low since 2000, accounting for less than 25 events per year. Due to variation in these low numbers, we can expect to see the prevalence rate for New Hampshire vary somewhat from year to year. Similar to pneumoconiosis, mesothelioma has a long latency period (10–20 years) so current rates may not be indicative of current exposures.
Because mesothelioma is associated with asbestos exposure, the years of ship building and asbestos use in New Hampshire may have contributed to these higher incidence rates. While practices at the shipyards have since changed and we can expect the rate to decrease in the future, the initial exposure to unsafe working environments may continue to impact New Hampshire residents for years to come.
Indicator 13: Elevated Blood Lead Levels among Adults
Introduction
Lead poisoning among adults is primarily due to occupational or hobby-related exposure. Lead adversely affects multiple organ systems and can cause permanent damage. Exposure to lead in adults can cause anemia, nervous system dysfunction, kidney damage, hypertension, decreased fertility, and miscarriage. Workers bringing lead dust home on their clothing can expose their children to lead. The blood lead level (BLL) is the best biological indicator of recent lead exposure.
The summary data below was produced as a collaboration between the State of New Hampshire Department of Health and Human Services, Division of Public Health Services, Environmental Public Health Tracking Program (EPHT) and Healthy Homes and Lead Poisoning Prevention Program (HHLPPP).4 The HHLPPP submits data on behalf of the New Hampshire Occupational Health Surveillance Program to the National Institute for Occupational Safety and Health (NIOSH) for their Adult Blood Lead Epidemiology and Surveillance program (ABLES); therefore, ABLES standards are referenced in this document.5
Calculation
- Definition: Annual number of residents with elevated BLLs, Annual number of incident cases of residents with elevated BLLs. All reported state residents age 16 years or older, with a blood lead level of > 10, 25, and 40 μg/dL due to occupation. Prevalence and incidence were not calculated for this indicator.
- Data Source: NH Department of Health and Human Services, Healthy Homes and Lead Poisoning Prevention Program, Reports of elevated BLLs from laboratories. NH Adult Lead Report.
Data
Table 9: Blood lead levels over time, New Hampshire residents 16 years and older (2013-2020)
| Blood Lead Level | 2013 | 2014 | 2015 | 2016 | 2017 | 2018 | 2019 | 2020 |
|---|---|---|---|---|---|---|---|---|
| <5 µg/dL | 1,400 | 1,603 | 1,993 | 2,294 | 2,469 | 2,365 | 2,567 | 1,976 |
| 5-9 µg/dL | 202 | 223 | 208 | 239 | 245 | 234 | 166 | 137 |
| 10-24 µg/dL | 156 | 108 | 140 | 140 | 173 | 136 | 121 | 83 |
| 25+ µg/dL | 23 | 14 | 15 | 38 | 25 | 31 | 17 | 7 |
Note - The results in this and following tables are limited to the single highest blood lead value per person per year.
Figure 5. NH Elevated Blood Lead Levels, 2013-2020

| Sector | Total Cases | Percent [%] |
|---|---|---|
| Utilities | <5 | <5% |
| Construction | 28 | 34% |
| Manufacturing | 26 | 32% |
| Wholesale Trade | <5 | <5% |
| Administrative and Support and Waste Management and Remediation Services | 13 | 16% |
| Arts, Entertainment, & Recreation | 6 | 7% |
| Other Services (Auto Repair) | <5 | <5% |
| Public Administration | <5 | <5% |
Detailed NAICS codes specify more precise industries within these sectors. This allows for a clearer picture of specific industries at elevated risk for lead exposure in New Hampshire. Noteworthy industries identified among the known codes were:
- Remediation services (NAICS 562910) – 16% (13 cases)
- Painting and wall covering contractors (NAICS 238320) – 15% (12 cases)
- Residential building construction/residential remodelers (NAICS 23611/236118) – 13% (11 cases)
- Industrial valve manufacturing (NAICS 332911) – 10% (8 cases)
- Small arms and ordnance manufacturing (NAICS 332994) – 9% (7 cases)
Within the broad sector of Arts, Entertainment, and Recreation, all six cases were in All Other Amusement and Recreation Industries. This subsector includes establishments such as shooting ranges, which are known to be a potential occupational source of lead exposure.6
Discussion
Individuals with ongoing elevated BLLs are at greater risk for adverse health effects and are an indication that long-term airborne lead exposure continues to be a problem in lead industries.
Indicators 14 to 16: Percentage of Workers Employed in Industries and Occupations at High Risk for Occupational Morbidity and Mortality
Introduction
Industries with high risk of morbidity or mortality are based on Bureau of Labor Statistics “total reportable cases incidence rates” for private sector workers during a given year. These industries traditionally have occupational injury and illness rates of more than double the overall national rate. The list of high-risk industries was constructed using an across-the board threshold for “high-risk” based on national data. It is possible that certain industries on this list are more, or less, risky in an individual state. Therefore, this indicator is not a direct estimate of how much risk workers in New Hampshire experience at work. It only provides an aggregate estimate of how many workers are employed in industries which, at the national level, have been deemed high-risk.
A complete list of high-risk industry and occupation categories are provided in the Occupational Health Indicator Guide for Tracking Occupational Health Conditions and their Determinants. Note that indicators are independent of each other. So, for example, a secretary who works in the logging industry would be counted as working in a high-risk industry for mortality even though this person is at low risk of mortality from an occupational standpoint.
Calculation
- Definition: Number of employed persons in high morbidity risk North American Industry Classification System (NAICS) industries, and Percentage of employed persons in high morbidity risk (NAICS) industries.
- Numerator: Employed workers, 16 years of age and older, in private sector industries at high-risk for occupational morbidity
- Denominator: Employed persons age 16 years or older in all private sector industries for same calendar year
- Data Source: U.S. Census Bureau County Business Patterns (CBP)
Data
Table 11. Morbidity and Mortality by Industry and Occupation
| Indicator | 2017 | 2018 | 2019 | 2020 |
|---|---|---|---|---|
| Percent employed in industries at high risk for morbidity | 5.3% | 5.0% | 4.7% | 4.7% |
| Percent employed in industries at high risk for mortality | 13.8% | 14.4% | 13.5% | 14.2% |
| Percent employed in occupations in high risk for morbidity | 14.3% | 13.9% | 14.5% | 14.4% |
| Percent employed in occupations at high risk for mortality | 10.0% | 9.7% | 10.4% | 10.1% |
Indicator 18: OSHA Enforcement Activities
Introduction
In 1970, Congress established the Occupational Safety and Health Administration (OSHA). The OSHA mission is to “assure so far as possible every working man and woman in the nation safe and healthful working conditions.” This includes the authorization to conduct both referral and non-referral inspections on work sites. OSHA cannot inspect all 7 million workplaces covered by the OSH Act each year. The most hazardous workplaces need primary attention. OSHA, therefore, has established a system of inspection priorities in order to make the most positive impact on occupational safety and health, including imminent danger, catastrophes and fatal accidents, employee complaints, and planned, or programmed, inspections in industries with a high number of hazards and associated injuries.
Calculation
- Definition: Annual number of establishments inspected by OSHA; Estimated percentage of all establishments under OSHA jurisdiction inspected by OSHA; Annual number of employees whose work areas were inspected by OSHA; and Estimated percentage of all employees under OSHA jurisdiction whose work areas were inspected.
- Numerator: Total number of OSHA inspections; Total number of employed persons covered by OSHA inspections
- Total number of employed persons covered by OSHA inspections; Estimated number of employees under OSHA jurisdiction for the same calendar year
- Data Sources:
- OSHA annual reports of total inspections conducted, and the number of workers covered by these inspections
- Bureau of Labor Statistics’ data on Covered Employers and Wages (commonly referred to as the ES-202/QCEW data) for the number of workers employed and establishments in the public and private sectors
Data
Table 12. Estimated annual number and percentage of private sector establishments and employees in New Hampshire inspected under OSHA jurisdiction 2012–2020
| Year | Establishments | Employees | ||||
|---|---|---|---|---|---|---|
| Number of Inspections | Eligible for Inspections | Percent Inspected | Number Inspected | Eligible for Inspection | Percent Inspected | |
| 2012 | 370 | 46,625 | 0.8% | 7,079 | 532,863 | 1.3% |
| 2013 | 372 | 47,145 | 0.8% | 9,408 | 539,608 | 1.7% |
| 2014 | 377 | 47,600 | 0.8% | 9,055 | 546,917 | 1.7% |
| 2015 | 363 | 48,353 | 0.8% | 11,742 | 557,866 | 2.1% |
| 2016 | 279 | 49,065 | 0.6% | 7,960 | 568,454 | 1.4% |
| 2017 | 323 | 49,553 | 0.7% | 8,308 | 574,620 | 1.4% |
| 2018 | 306 | 50,054 | 0.6% | 9,869 | 578,973 | 1.7% |
| 2019 | 388 | 51,110 | 0.8% | 15,905 | 585,431 | 2.7% |
| 2020 | 226 | 52,709 | 0.4% | 3,969 | 548,386 | 0.7% |
Discussion
This indicator only measures enforcement activity. Because OSHA may conduct multiple inspections of the same establishment during the calendar year, the percentage of establishments inspected may be slightly overestimated. In addition, if OSHA conducts multiple inspections of the same worksite during the year, the number of workers covered by OSHA inspections may be over counted.
OSHA enforcement activities may correlate with workplace health and safety benefits, such as a reduction in the number of workplace injuries or illnesses. In some respects, OSHA enforcement activities may serve as a leading indicator of workplace safety, since the potential for a workplace to be inspected by OSHA may provide an incentive for employers to give more attention to workplace health and safety issues.
Indicator 19: Workers’ Compensation Awards
Introduction
Workers’ compensation claims are reviewed to establish whether the reported medical condition is work-related. Accepted claims represent known work-related injuries and illnesses and are often more severe cases. The total and average amounts of benefits paid provide an estimate of the burden of these events, which can help justify prevention programs and activities.
Calculation
- Definition: Total amount of workers’ compensation benefits paid; and Average amount of workers’ compensation benefits paid per covered worker.
- Numerator: Total amount of workers’ compensation benefits paid.
- Denominator: Number of workers with workers’ compensation coverage for the same calendar year.
- Data Sources: National Academy of Social Insurance Reports: Workers Compensation: Benefits, Coverage, and Costs.
Data
Table 13. Workers’ Compensation Benefits Paid per Covered Job, New Hampshire 2012-2020
| Year | Workers' Compensation | |||
|---|---|---|---|---|
| Total Benefits Paid | Covered Jobs | Benefits Paid per Covered Worker | Benefits Paid per Covered Worker Adjusted by CPI-U for 2020 | |
| 2012 | 231,235,000 | 605,000 | 382 | 439.0 |
| 2013 | 225,500,000 | 611,000 | 369 | 417.0 |
| 2014 | 212,778,000 | 619,000 | 344 | 383.0 |
| 2015 | 213,923,000 | 629,000 | 340 | 379.0 |
| 2016 | 205,663,000 | 640,000 | 321 | 353.0 |
| 2017 | 209,535,000 | 646,000 | 324 | 347.0 |
| 2018 | 209,489,000 | 651,000 | 322 | 338.0 |
| 2019 | 210,478,000 | 657,000 | 320 | 331.0 |
| 2020 | 201,706,000 | 616,000 | 327 | 327.0 |
Discussion
This is a gross indicator of the burden of occupational injury and illness. It does not include human, noneconomic costs or economic costs associated with occupational injuries and illnesses. These data are more appropriate for evaluating trends within a state than for making comparisons between states because of differences in wages and medical costs, the compensation determination, industry types and risks, and policies on permanent disability payments. Even within a state, changes in policies, wages and medical care expenses must be considered.
Indicator 21: Asthma Among Adults Caused or Made Worse by Work
Introduction
NH has some of the highest rates of adult asthma in New England, affecting 17.4% of NH adults in 2021, which is up from 15.4% in 2020.7 Work-related asthma is asthma triggered by an exposure at work. Many asthma triggers can be found in the workplace. Avoiding triggers can prevent asthma from getting worse. The proportion of work-related asthma among persons with current asthma may differ within various industry and occupation groups.8 Estimating the burden of asthma caused or made worse by work can be useful to prioritize and guide prevention strategies within high-risk industries and occupations.
Calculation
- Definition: Weighted estimate of the number of ever-employed adults with current asthma who report their asthma was caused or made worse by work; and Estimated percent of ever-employed adults with current asthma who report that their asthma was caused or made worse by work.
- Numerator: Ever-employed adults with current asthma who report that their asthma was caused or made worse by exposures at work.
- Denominator: Ever-employed adults (18 years or older) with current asthma.
Data
Table 14. Asthma Cases Caused by
Exposure at Work, 2014-2020
| Year | Estimated Asthma Cases Caused by Exposure at Work |
|---|---|
| 2014 | 47,810 |
| 2015 | 46,760 |
| 2016 | 58,245 |
| 2017 | 74,001 |
| 2018 | 69,557 |
| 2019 | 46,748 |
| 2020 | 52,548 |
Discussion
Asthma continues to be on the rise in New Hampshire. Industries with some of the highest proportion of NH workers reporting current asthma include Accommodation and Food Services, Educational Services, and Healthcare and Social Assistance. Occupations with the highest prevalence for asthma include Healthcare Support, Personal Care and Service, Education, and Training and Library. Service oriented occupations are potentially exposed to a number of well-known asthma-related substances in the workplace, including disinfecting agents, cleaning products, mold, dust mites, pesticides, cosmetic products and bleaches. There are also environmental substances that may be encountered at work that can make asthma symptoms worse, including tobacco smoke, air pollution, and allergens from plant pollen, animal dander, and perfumes.9
Workers who are exposed to both environmental and workplace irritants are at higher risk. In order to further investigate the relationship between asthma and work in the future, ensuring the capture of industry and occupation data in the BRFSS will be crucial. This information will help to expedite efforts to reduce exposures to asthmagens in workplaces where it is most prevalent. It can help improve prevention and control strategies to workers who, because of their occupation or the materials they handle, are at high risk for the burden of work-related asthma.
Indicator 22: Work-Related Severe Traumatic Injury Hospitalizations
Introduction
Acute work-related trauma is a leading cause of death and disability among U.S. workers.
Calculation
- Definition: Annual Number of ED visits for persons age 16 years or older; Annual crude rate of ED visits per 100,000 employed persons age 16 years or older
- Numerator: Inpatient hospital discharges with (1) primary payer coded as workers’ compensation, AND (2) first-listed diagnosis contained in the specified list of severe traumatic injuries
- Denominator: Employed persons age 16 years or older for the same calendar year
- Data Source: Emergency department visits data; BLS Current Population Survey Data
Data
Table 15. Work-Related Inpatient Hospitalizations for Severe Traumatic Injury, 2019-2020
| Year | Total Hospitalizations | Hospitalizations per 100,000 employed persons |
|---|---|---|
| 2019 | 31 | 4.1 |
| 2020 | 31 | 4.4 |
Discussion
Changes in hospitalization practices and workers’ compensation coverage/reporting may increasingly reduce capture of minor injuries but have little effect on severe injuries. Accurate characterization of injury trends is critical to understanding how we are doing as a nation with regard to occupational injury prevention.
Indicator 24: Occupational Heat-Related Emergency Department (ED) Visits
Introduction
Workers who are exposed to extreme heat or work in hot environments may be at risk of heat stress. Exposure to extreme heat can result in occupational illnesses and injuries. Heat stress can result in heat stroke, heat exhaustion, heat cramps, or heat rashes. Heat can also increase the risk of injuries in workers as it may result in sweaty palms, fogged-up safety glasses, and dizziness. Burns may also occur as a result of accidental contact with hot surfaces or steam.10
Workers at risk of heat stress include outdoor workers and workers in hot environments such as firefighters, bakery workers, farmers, distribution center workers, construction workers, miners, boiler room workers, factory workers, and others.
Calculation
- Definition: Annual Number of ED visits for persons age 16 years or older; Annual crude rate of ED visits per 100,000 employed persons age 16 years or older.
- Numerator: Emergency department (ED) visits for persons aged 16 years or older with a primary or contributing diagnosis of heat-related illness, AND with primary payer coded as workers’ compensation, OR a work-related E-code
- Denominator: Employed persons age 16 years or older for the same calendar year
- Data Source: Emergency department visits data; BLS Geographic Profiles of Employment and Unemployment
Data
Table 16. Emergency Department Visits for Occupational Heat-Related Illness, 2018-2020
| Year | Total Visits | Visits per 100,000 employed persons |
|---|---|---|
| 2018 | 26 | 3.5 |
| 2019 | 25 | 3.3 |
| 2020 | 15 | 2.1 |
Discussion
This indicator likely underestimates the burden of work-related heat illness for several reasons. First, residents of outside states, or cases with unknown residence are not counted, even if their heat illness occurred while working in the state where care was sought. Patients of unknown age are not counted. Additionally, attribution of payer in ED discharge records may not be accurate. Work-related encounters may not be recognized as such if workers’ compensation is not listed as the intended payer at the time of the visit. Finally, the majority of individuals with work-related illnesses and injuries do not file for workers’ compensation, and many types of workers are not eligible for workers’ compensation.
References
2 Azaroff LS, Levenstein C, Wegman DH.: Occupational injury and illness surveillance: conceptual filters explain underreporting. Am J Public Health 2002;92:1421--9.
3 National Institute for Occupational Safety and Health, Pneumoconioses
4 National Institute for Occupational Safety and Health, Adult Blood Lead Epidemiology Surveillance (ABLES) at the CDC's Workplace Safety and Health Topics pages for Understanding Blood Lead Levels and Adult Blood Lead Epidemiology and Surveillance (ABLES).
5 State of New Hampshire Adult Blood Lead Report: 2013-2020 April 2023 New Hampshire Department of Health and Human Services Division of Public Health Services
6 Occupational Safety and Health Administration. (2018, August). Protecting workers from lead hazards at Indoor Firing Ranges. Retrieved February 17, 2023.
7 Behavioral Risk Factor Surveillance System (BRFSS) Prevalence Data
8 National Institute for Occupational Safety and Health, Work-Related Asthma
9 Occupational Injury and Illness in New Hampshire, Data Report to Inform Programs and Policies, March 2021
10 National Institute for Occupational Safety and Health, Heat Stress