Contributors
Liu Yang, Ph.D., Karla Armenti, MS, Sc.D.
NH Occupational Health Surveillance Program, Institute on Disability, University of New Hampshire
Suggested citation
Yang, L., & Armenti, K. (2026). Direct Care Workers’ Safety and Health During the COVID-19 Pandemic (pp. 1–47). NH Occupational Health Surveillance Program, Institute on Disability, University of New Hampshire.
Table of Contents
- Introduction
- Methods
- Results
- Study Limitations
- Conclusions
- References
Executive Summary
The New Hampshire Occupational Health Surveillance Program (NH OHSP) has prepared the following report based on a study conducted on New Hampshire Direct Care Workers’ (DCWs) safety and health during the COVID-19 pandemic, focusing on workplace safety practices and DCWs’ COVID-19 infection and vaccination experiences.
The study targeted DCWs who provided direct care services to New Hampshire clients (full-time or part-time) during the COVID-19 pandemic period (January 2020 to May 2023). A total of 288 valid survey responses were recorded from January to February 2024, via the UNH Qualtrics online survey platform. The online survey focused on a range of topics, including workers’ employment status and work schedule during the COVID-19 pandemic, workplace safety and health preparedness, and COVID-19 infection and vaccination. The study was jointly funded by the University Centers for Excellence in Developmental Disabilities Education, Research, and Service (UCEDD) and the National Institute for Occupational Safety and Health (NIOSH).
Study participants served all 10 counties in NH, with 30% working in two or more counties. Most of the DCWs served people with intellectual and developmental disabilities (IDD) (70%) and worked at agency or facility settings (58%). The study participants held an average age of 34, with 74% being female and 83% white (non-Hispanic). 60% of the participants held a Bachelor’s degree or higher, and 82% had more than 3 years of DCW work experience.
The report highlights the following major findings:
- During the COVID-19 pandemic, nearly half of the participants (47%) worked more than 40 hours per week, and 18% worked more than 50 hours. The majority (86%) reported feeling pressure working long hours or less than 40 hours. In addition to changes in working hours, people had other work schedule changes, such as paid (15%) or unpaid furlough (15%), and remote work/telehealth (21%).
- About 16% of the participants struggled with having enough personal protective equipment (PPE) and hygiene supplies. Among the 75% participants who had enough supplies, more than half of them had to obtain them using personal resources. People with less than 5 years of job experience were less likely to have their employers provide enough PPE and hygiene supplies (32% vs. 44%).
- 98% of the participants reported that their employers had workplace COVID-19 safety measures, despite requirements loosening up after the COVID-19 vaccines were available.
- 50% of the participants with less than 5 years of job experience and 29% with more than 5 years of job experience were not always able to take safety measures at work, or most of the time. Similarly, young people (<=34 years old) were more likely to report not being able to take safety measures at work (46% vs. 39%). Barriers included “lack of necessary facilities/infrastructures” (44%), “job task didn’t allow me” (42%), and “clients discouraged me” (42%).
- 75% of the participants had tested positive for COVID-19, among which 46% had their first COVID-19 infection as early as 2020. 74% thought that half or more of the infection(s) were due to work-related factors. 87% had at least one long COVID symptom, and 69% reported having two symptoms or more. The long COVID symptoms impacted 34% of the participants moderately, and 40% participants “very much” or “extremely”.
- 92% of the participants had at least one dose of the COVID-19 vaccine. Regarding reasons to get the vaccination, among people who ranked at least one of the three, “Employer Mandates”, “Employer Incentives”, “Client requests” as the top 5 reasons, 11% said they would not consider the vaccination without mandates, and another 30% hesitated to choose vaccination overall.
- Regarding the effectiveness of the COVID-19 vaccine, 26% of the participants believed that the COVID-19 vaccine definitely protected them and the people around them, followed by 37% who answered “probably yes”, leaving the other 37% not sure about the COVID-19 vaccine’s effects.
Introduction
Direct Care Workers (DCWs) play a vital role in America’s workforce by providing daily caregiving and support services to people in need, including older adults and people with disabilities. DCWs often work in facility settings such as group homes, assisted living communities, or nursing homes, and non-facility settings such as family or individual homes. DCWs often assist people with essential daily tasks and activities, or support people with intellectual and developmental disabilities working across a range of settings, including vocational and day training programs (Scales, 2020).
There are nearly 4.8 million DCWs in the U.S. based on 2022 national estimates, among which 85% are women and 64% are people of color (Paraprofessional Healthcare Institute (PHI), 2024). Low wages and poor job quality have been negatively impacting employment experiences and occupational health and well-being of DCWs. The COVID-19 pandemic has highlighted DCWs’ essential contributions while exposing them to higher risks and exacerbated work, safety, and health risks (Denny-Brown, 2020; Scales, 2021). Research showed that DCWs frequently came into close contact with their clients, and as such faced a higher likelihood of contracting and transmitting the virus (Sterling et al., 2020). A lack of personal protective equipment (PPE) and other work safety resources exacerbated this risk, leaving workers vulnerable with increasing anxiety levels (Feldman et al., 2023). Additionally, the disruptions in the availability of essential supplies and services led to heightened stress and uncertainty about ensuring the safety of themselves and their clients. DCWs often struggled to access basic needs such as masks, gloves, and sanitizers, making it challenging to maintain proper infection control measures at the beginning of the pandemic until safety policies and guidelines were established.
It is important to understand the safety, health, and well-being of DCWs, especially during the COVID-19 pandemic. This study is particularly significant given the prolonged labor shortage of the workforce and significantly increasing demand of DCWs, which has been manifested since the pandemic.
Methods
Study design and data collection
The study targeted DCWs who provided direct care services to New Hampshire clients (full-time or part-time) during the COVID-19 pandemic period (January 2020 to May 2023). Eligible study participants needed to be at least 18 years old, and their primary responsibilities (more than 50% of job roles) included direct care services or the supervision of DCWs. Employees providing nursing or other professional licensed work (such as LPNs, RNs, physical therapy aides (PTAs), certified occupational therapist assistants (OTA)), CEOs, on-call employees, and independent providers were excluded from the study.
The survey questionnaire was developed by referencing existing surveys, including the NIOSH Worker Well-Being Questionnaire (WellBQ) (CDC, 2024b), NIOSH Quality of Worklife Questionnaire (CDC, 2024a), the Direct Support Workforce and COVID-19 Survey by the University of Minnesota’s Institute on Community Integration and the National Alliance for Direct Support Professionals (Pettingell et al., 2022). The questionnaire was developed using Qualtrics, an online survey platform. It was first reviewed by researchers with a diverse array of backgrounds in occupational safety and health, direct care, and disability research, and then pre-tested among researchers and a small group of DCWs working in nearby states (Maine and Massachusetts).
The survey data collection was conducted from January to February 2024. Recruitment flyers containing the survey scan codes were distributed via emails and newsletters to relevant research networks and posted through the UNH Institute on Disability social media platforms. As an incentive, we offered those participants willing to provide an email address the opportunity to be part of a drawing to win a gift card of $50. The study was approved by UNH IRB for human subject research ethics (IRB-FY2023-256).
Data cleaning
A total of 2098 survey responses were obtained, among which 1433 cases were eligible based on preset criteria. However, we noticed a significant amount of fraudulent responses, which might be introduced by the social media recruitment campaign, as reported in existing studies (Bonett et al., 2024; Pozzar et al., 2020). We implemented a set of screening strategies to exclude invalid and suspicious responses:
- Limited to responses submitted from New Hampshire and 3 nearby states (Massachusetts, Vermont, Maine), as identified by IP address and geolocation recorded;
- Excluded incomplete responses (only answered screening questions);
- For responses started at irregular times between 12 am and 5 am, we marked them as “Suspicious”, and those started at 2 am and 4 am were further deemed as fraudulent.
- Responses completed with a time duration under the 1st quantile (715s) were deemed as “Suspicious”, while those under 480s were deemed as fraudulent;
- Responses providing exactly the same answers to a set of key questions were deemed as “Suspicious”. We further manually reviewed these responses to identify those that appeared to be fraudulent. We used different sets of key questions until we reached saturation (i.e., no new responses were identified as suspicious/fraudulent using a new set of key questions);
- By reviewing consistency across survey questions, we manually coded responses as valid or suspicious;
- We further reviewed responses that provided text answers to open questions to identify responses that were thought to be valid;
- We also reviewed email addresses provided in the responses, trying to identify suspicious ones;
- Considering that bots might fill the survey for the gift incentive, we further reviewed responses that declined receiving the gift, and found they seemed to be valid;
- If a response was marked as “Suspicious” twice or more in the above regards, it was then marked as fraudulent, unless manual review decided otherwise.
After the screening process, we finalized the dataset with a total of 288 valid responses.
Statistical Analysis
All data analyses were performed using R (Version 4.4.1). Main libraries used include: knitr, tidyverse, dplyr, ggplot2.
Results
Basic demographics
The average age of study participants was 34.2, ranging from age 22 to age 71. 90% of the participants were aged 25 to 44 (excluding missing data, Table 1). Most participants were female (74%), and white (Non-Hispanic) (83%). About 60% of the participants held a Bachelor’s degree or higher, with another 27% holding some college/Associate’s degree. The majority of the participants were married or living with a partner (86%), and more than half of them (55%) claimed to be the family head. On average, each participant had 3.2 dependents in his/her family, with 3-4 dependents being the most common (55%). 65% of the participants had an annual family income between $35,000 - $74,999, and another 30% had $75,000 or more.
Detailed participants’ demographic information is shown in Table 1-1 to Table 1-8.
Note: Unless otherwise indicated, the percentage was calculated excluding missing data.
Table 1-1. Participants’ age group
| Age | Number of Participants | Percentage(%) |
|---|---|---|
20-24 | 8 | 2.9 |
25-34 | 160 | 57.6 |
35-44 | 88 | 31.7 |
45-54 | 12 | 4.3 |
55-64 | 7 | 2.5 |
>=65 | 3 | 1.1 |
Table 1-2. Participants’ gender
| Gender | Number of Participants | Percentage(%) |
|---|---|---|
| Female | 205 | 73.7 |
| Male | 75 | 27 |
| Other | 1 | 0.4 |
Table 1-3. Participants’ race and ethnicity
| Race & Ethnicity | Number of Participants | Percentage(%) |
|---|---|---|
| White | 230 | 82.7 |
| Other races (Non-Hispanic) | 37 | 13.3 |
| Hispanic, any race(s) | 11 | 4 |
TableTable 1-4. Participants’ education
| Education | Number of Participants | Percentage(%) |
|---|---|---|
| High school or below | 37 | 13.4 |
| Some college/Associate's Degree | 76 | 27.4 |
| Bachelor's degree and above | 164 | 59.2 |
TableTable 1-5. Participants’ family head status (i.e., Primary wage earner in the household)
| Family head status | Number of Participants | Percentage(%) |
|---|---|---|
| Family head | 155 | 55.2 |
| Not a family head | 126 | 44.8 |
Table 1-6. Participants’ marital status
| Marital Status | Number of Participants | Percentage(%) |
|---|---|---|
| Married or living with a partner | 242 | 86.4 |
| Single/Separated | 38 | 13.6 |
Table 1-7. How many dependents live with a participant
| Number of Dependents | Number of Participants | Percentage(%) |
|---|---|---|
| 0-2 dependents | 77 | 27.4 |
| 3-4 dependents | 155 | 55.2 |
| 5 or more dependents | 49 | 17.4 |
Table 1-8. Participants’ family income
| Family Income | Number of Participants | Percentage(%) |
|---|---|---|
| Less than $34,999 | 13 | 4.7 |
| Between $35,000 - $74,999 | 182 | 65.2 |
| Greater than $75,000 | 84 | 30.1 |
Employment status
Nearly half of the participants (46%, Table 2-1 & Figure 1) had 3-5 years of DCW working experience, followed by 5-10 years (30%), and 1-3 years (17%). About 22% of the participants reported having changed their primary employer during the COVID-19 pandemic. More than 1/3 of the participants (37%) had more than one job title. The most common job titles included Direct Care Worker (48%), Personal Care Assistant (17%), and Direct Support Worker/Direct Support Professional (15%). The study participants served all 10 counties in New Hampshire, with 30% working in more than one county. Regarding work settings, most NH DCWs worked in agency or facility settings (e.g., group homes, nursing homes, assisted living, intermediate care facilities, community programs, sheltered workshop or day program) (58%), and family or individual homes (51%). About 30% of the participants worked in two or more work settings. Most clients were people with intellectual and developmental disabilities (IDD) (70%), older adults (64%), and people with physical disabilities (55%). More than half of the participants served more than one type of client (61%).
Detailed participants’ employment information is shown in Table 2-1 to Table 2-10, and Figure 1.
Note: Unless otherwise indicated, the percentage was calculated excluding missing data.
Table 2-1. Participants’ job tenure
| Participants’ Job Tenure | Number of Participants | Percentage(%) |
|---|---|---|
| Less than a year | 4 | 1.4 |
| 1-3 years | 47 | 16.5 |
| 3-5 years | 131 | 46.1 |
| 5-10 years | 86 | 30.3 |
| 10-20 years | 9 | 3.2 |
| More than 20 years | 7 | 2.5 |
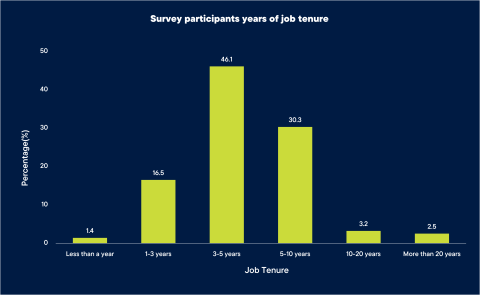
Figure 1. Job tenure as a Direct Care Worker (DCW)
Table 2-2. Did participants change primary employer during the pandemic
| Changed Primary Employer | Number of Participants | Percentage (%) |
|---|---|---|
| Yes | 63 | 22.1 |
| No | 222 | 77.9 |
Table 2-3. How many job titles did a participant have
| Number of Job Titles | Number of Participants | Percentage (%) |
|---|---|---|
1 | 180 | 62.7 |
2 | 77 | 26.8 |
3 | 22 | 7.7 |
4 | 7 | 2.4 |
5 | 1 | 0.3 |
Table 2-4. Job titles that participants had
| Job Title | Number of Participants | Percentage (%) |
|---|---|---|
Direct Care Worker | 139 | 48.4 |
Personal Care Assistant | 50 | 17.4 |
Home Health Aide/Home Health Assistant | 40 | 13.9 |
Residential Aide/Residential Assistant | 35 | 12.2 |
House Managers with primarily | 35 | 12.2 |
Direct Support Worker / Direct Support Professional | 44 | 15.3 |
Job Coach for persons supported | 29 | 10.1 |
Manager or Supervisor of DCWs | 25 | 8.7 |
Site Director or Program Coordinator | 19 | 6.6 |
Certified nursing assistant (CNA) | 15 | 5.2 |
Others | 2 | 0.7 |
Table 2-5. New Hampshire counties where participants worked
| County in New Hampshire | Number of Participants | Percentage (%) |
|---|---|---|
Belknap | 31 | 10.8 |
Carroll | 58 | 20.1 |
Cheshire | 50 | 17.4 |
Coos | 52 | 18.1 |
Grafton | 53 | 18.4 |
Hillsborough | 46 | 16.0 |
Merrimack | 56 | 19.4 |
Rockingham | 33 | 11.5 |
Strafford | 27 | 9.4 |
Sullivan | 10 | 3.5 |
Table 2-6. How many New Hampshire counties did a participant work in
| Number of Counties Worked In | Number of Participants | Percentage (%) |
|---|---|---|
1 | 200 | 69.4 |
2 | 54 | 18.8 |
3 | 29 | 10.1 |
4 | 4 | 1.4 |
5 | 1 | 0.3 |
Table 2-7. Work settings that participants worked in
| Work Setting | Number of Participants | Percentage (%) |
|---|---|---|
| Agency or facility settings | 168 | 58.3 |
| Family or individual homes | 148 | 51.4 |
| Community employment or job sites | 64 | 22.2 |
| Others | 1 | 0.3 |
Table 2-8. How many work settings did a participant work in
| Number of Work Settings | Number of Participants | Percentage (%) |
|---|---|---|
| 1 | 198 | 68.8 |
| 2 | 87 | 30.2 |
| 3 | 3 | 1.0 |
Table 2-9. Type of clients that participants worked with
| Type of Clients | Number of Participants | Percentage (%) |
|---|---|---|
| Older adults | 185 | 64.2 |
| People with IDD | 202 | 70.1 |
| People with physical disabilities | 157 | 54.5 |
| Others | 4 | 1.4 |
Table 2-10. How many types of clients did a participant work with
| Number of Client Types | Number of Participants | Percentage (%) |
|---|---|---|
| 1 | 112 | 38.9 |
| 2 | 92 | 31.9 |
| 3 | 84 | 29.2 |
Work schedule
During the COVID-19 pandemic, nearly half of the participants (47%) worked more than 40 hours per week, and 18% worked more than 50 hours (Table 3). About 17% of the participants worked less than 30 hours per week. Facing the condition of working long hours or less than 40 hours, 40% of the participants sometimes felt pressure, 41% felt pressure most of the time, and about 10% felt pressure all the time.
All except one participant had at least one work schedule change during the COVID-19 pandemic. Common schedule changes included working more hours (45%), working less hours (28%), remote work/telehealth (21%), paid furlough (15%), and unpaid furlough/unemployed (15%). 61% of the participants had a flexible work schedule during the pandemic, such as being able to choose the day/time to work.
Detailed participants’ work schedule information is shown in Table 3-1 to Table 3-7.
Note: Unless otherwise indicated, the percentage was calculated excluding missing data.
Table 3-1. Working hours per week
| Hours per Week | Number of Participants | Percentage (%) |
|---|---|---|
| Less than 20 hours | 9 | 3.1 |
| 20 to 30 hours | 39 | 13.5 |
| 30 to 40 hours | 105 | 36.5 |
| 40 to 50 hours | 84 | 29.2 |
| 50 to 60 hours | 43 | 14.9 |
| Greater than 60 hours | 8 | 2.8 |
Table 3-2. Feeling pressure to work long hours during the pandemic
Limited to participants who worked more than 40 hours.
| Feeling Pressure | Number of Participants | Percentage (%) |
|---|---|---|
| Never | 2 | 1.5 |
| Rarely | 10 | 7.4 |
| Sometimes | 52 | 38.5 |
| Most of the time | 59 | 43.7 |
| Always | 12 | 8.9 |
Table 3-3. Feeling pressure to work less hours during the pandemic
Limited to participants who worked less than 40 hours.
| Feeling Pressure | Number of Participants | Percentage (%) |
|---|---|---|
| Never | 0 | 0.0 |
| Rarely | 8 | 14.3 |
| Sometimes | 23 | 41.1 |
| Most of the time | 19 | 33.9 |
| Always | 6 | 10.7 |
Table 3-4. Feeling pressure to work long or less hours during the pandemic
Combined responses from participants who worked more than 40 hours and less than 40 hours.
| Feeling Pressure | Number of Participants | Percentage (%) |
|---|---|---|
| Never | 2 | 1.0 |
| Rarely | 18 | 9.4 |
| Sometimes | 75 | 39.3 |
| Most of the time | 78 | 40.8 |
| Always | 18 | 9.4 |
Table 3-5. Experienced work changes during the pandemic
| Work Change | Number of Participants | Percentage (%) |
|---|---|---|
| Did not work pre-pandemic | 12 | 4.2 |
| Worked more hours | 128 | 44.6 |
| Worked less hours | 79 | 27.5 |
| Paid furlough | 43 | 15.0 |
| Unpaid furlough/unemployed | 43 | 15.0 |
| Worked remotely | 61 | 21.3 |
| Salary increase | 35 | 12.2 |
| Others | 4 | 1.4 |
Table 3-6. How many work changes did a participant experience during the pandemic
| Number of Work Changes | Number of Participants | Percentage (%) |
|---|---|---|
| 1 | 192 | 66.9 |
| 2 | 74 | 25.8 |
| 3 | 19 | 6.6 |
| 4 | 2 | 0.7 |
Table 3-7. Employer allowed a flexible work schedule during the pandemic
| Flexible Work Schedule | Number of Participants | Percentage (%) |
|---|---|---|
| No | 110 | 38.2 |
| Yes | 175 | 60.8 |
| Don't know | 3 | 1.0 |
Work safety
At the beginning of the COVID-19 pandemic in early 2020, about 16% of the participants didn’t have enough personal protective equipment (PPE) (such as face covering or surgical masks, N95 masks, face shield/splash guard, gloves, gown/coveralls) and hygiene supplies (hand sanitizer and disinfectant) at work (Table 4-1). Among the 75% of participants who had enough PPE and hygiene supplies, more than half of them had to obtain the supplies through personal resources other than their employers. People with less than 5 years of DCW job experience were more likely to report that they didn’t have enough PPE or hygiene supplies (17% vs. 14%), or were able to obtain PPE and hygiene supplies for work via personal resources (40% vs. 37%), but less likely to report having their employers provide enough PPE and hygiene supplies (32% vs. 44%) (Figure 2).
98% of the participants reported that their employers had workplace COVID-19 safety measures, including face masks or coverings, social distancing, workplace cleaning and disinfecting, health screenings for employees and visitors, COVID-19 testing, and staff quarantine. More employers had the requirements before the COVID-19 vaccines were available than after, except for workplace cleaning and disinfecting (Figure 3). 70% of the participants said that their employers provided free COVID testing.
Regarding taking safety measures at work, 42% of the participants were not always able to take safety measures at work or most of the time. The percentage was even higher among people with less than 5 years of job experience as compared to people with longer job experience (50% vs. 29%). Similarly, people in the younger age group (<=34 years old) more often reported not being able to take safety measures at work, as compared to people with older age (>= 35 years old) (46% vs. 39%) (Figure 4-5). In terms of barriers to taking safety measures, most people reported “lack of necessary facilities/infrastructures” (44%), followed by “job task didn’t allow me” (42%) and “clients discouraged me” (42%) (Figure 6).
We asked the participants to rank information sources for work safety during the pandemic. Most people ranked “Company intranet, webpage and newsletters”, “Workplace posters/signage”, “Safety and health training and education”, and “Staff meetings or formal communication with manager/supervisor” as the top 5 (Figure 7). Government channels such as the CDC and state/local health departments were less likely to be ranked as top 5 sources by the participants.
Detailed information about DCWs’ work safety is shown in Tables 4-1 to 4-8, and Figures 2 to Figure 7.
Note: Unless otherwise indicated, the percentage was calculated excluding missing data.
Personal Protective Equipment (PPE) availability at the beginning of the pandemic
Table 4-1a. Had enough Personal Protective Equipment (PPE) at the beginning of the pandemic
| Overall PPE Availability | Number of Participants | Percentage (%) |
|---|---|---|
| Yes, employers provided enough PPE and hygiene supplies | 104 | 36.5 |
| Yes, but through my personal resources | 110 | 38.6 |
| Didn't have enough PPE or hygiene supplies | 45 | 15.8 |
| Didn't work as DCW that time | 14 | 4.9 |
| Don't know | 12 | 4.2 |
Table 4-1b. Had enough Personal Protective Equipment (PPE) at the beginning of the pandemic, by job tenure
Job Tenure | PPE Availability | Number of Participants | Percentage (%) |
|---|---|---|---|
| Under 5 Years | Yes, employers provided enough PPE and hygiene supplies | 58 | 32.2 |
| Under 5 Years | Yes, but through my personal resources | 72 | 40.0 |
| Under 5 Years | Didn't have enough PPE or hygiene supplies | 31 | 17.2 |
| Under 5 Years | Didn't work as DCW that time | 7 | 3.9 |
| Under 5 Years | Don't know | 12 | 6.7 |
| 5 Years or More | Yes, employers provided enough PPE and hygiene supplies | 44 | 43.6 |
| 5 Years or More | Yes, but through my personal resources | 37 | 36.6 |
| 5 Years or More | Didn't have enough PPE or hygiene supplies | 14 | 13.9 |
| 5 Years or More | Didn't work as DCW that time | 6 | 5.9 |
| 5 Years or More | Don't know | 0 | 0.0 |
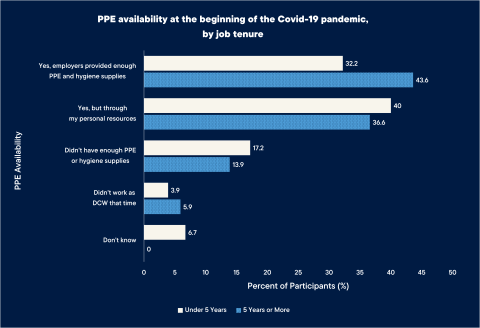
Figure 2. Personal Protective Equipment (PPE) availability at the beginning of the pandemic, by job tenure
Workplace safety measures
Table 4-2a. Were face masks or coverings required?
| Face masks or covering | Number of Participants | Percentage (%) |
|---|---|---|
| Never required | 25 | 10.3 |
| Required before vaccines available | 143 | 58.8 |
| Required after vaccines available | 109 | 44.9 |
Table 4-2b. Was social distancing required?
| Social distancing | Number of Participants | Percentage (%) |
|---|---|---|
| Never required | 31 | 12.8 |
| Required before vaccines available | 136 | 56.2 |
| Required after vaccines available | 106 | 43.8 |
Table 4-2c. Was workplace cleaning and disinfecting required?
| Workplace cleaning and disinfecting | Number of Participants | Percentage (%) |
|---|---|---|
| Never required | 31 | 12.4 |
| Required before vaccines available | 121 | 48.6 |
| Required after vaccines available | 137 | 55.0 |
Table 4-2d. Were health screenings for employees and visitors required?
| Health screenings for employees and visitors | Number of Participants | Percentage (%) |
|---|---|---|
| Never required | 44 | 17.9 |
| Required before vaccines available | 120 | 48.8 |
| Required after vaccines available | 118 | 48.0 |
Table 4-2e. Was COVID-19 testing required?
| COVID-19 testing | Number of Participants | Percentage (%) |
|---|---|---|
| Never required | 32 | 14.0 |
| Required before vaccines available | 127 | 55.5 |
| Required after vaccines available | 113 | 49.3 |
Table 4-2f. Was Staff quarantine required?
| Staff quarantine | Number of Participants | Percentage (%) |
|---|---|---|
| Never required | 21 | 9.5 |
| Required before vaccines available | 125 | 56.3 |
| Required after vaccines available | 116 | 52.3 |

Figure 3. Safety measures used in the workplace
Table 4-3. How many safety measures did an employer require in the workplace
| Number of Safety Measures | Number of Participants | Percentage (%) |
|---|---|---|
| 0 | 6 | 2.1 |
| 1 | 10 | 3.5 |
| 2 | 21 | 7.4 |
| 3 | 25 | 8.8 |
| 4 | 72 | 25.4 |
| 5 | 62 | 21.9 |
| 6 | 87 | 30.7 |
Table 4-4. Did employers provide free COVID testing
| Free COVID testing | Number of Participants | Percentage (%) |
|---|---|---|
| Yes | 193 | 69.2 |
| No | 86 | 30.8 |
Table 4-5a. How often were DCWs able to take appropriate safety measures at work, overall
| Overall | Number of Participants | Percentage (%) |
|---|---|---|
| Never | 3 | 1.0 |
| Rarely | 27 | 9.4 |
| Sometimes | 91 | 31.8 |
| Most time | 107 | 37.4 |
| Always | 58 | 20.3 |
Table 4-5b. How often were DCWs able to take appropriate safety measures at work, by job tenure
| Job Tenure | Could take appropriate safety measures at work | Number of Participants | Percentage (%) |
|---|---|---|---|
| Under 5 Years | Never | 1 | 0.6 |
| Under 5 Years | Rarely | 19 | 10.5 |
| Under 5 Years | Sometimes | 70 | 38.7 |
| Under 5 Years | Most time | 59 | 32.6 |
| Under 5 Years | Always | 32 | 17.7 |
| 5 Years or More | Never | 2 | 2.0 |
| 5 Years or More | Rarely | 8 | 7.9 |
| 5 Years or More | Sometimes | 19 | 18.8 |
| 5 Years or More | Most time | 47 | 46.5 |
| 5 Years or More | Always | 25 | 24.8 |

Figure 4. Ability to take safety measures at work, by job tenure
Table 4-5d. How often were Direct Care Workers (DCWs) able to take appropriate safety measures at work, by age group
| Age | Could take appropriate safety measures at work | Number of Participants | Percentage (%) |
|---|---|---|---|
| 34 years or younger | Never | 2 | 1.2 |
| 34 years or younger | Rarely | 15 | 8.9 |
| 34 years or younger | Sometimes | 60 | 35.7 |
| 34 years or younger | Most time | 58 | 34.5 |
| 34 years or younger | Always | 33 | 19.6 |
| 35 years or older | Never | 1 | 0.9 |
| 35 years or older | Rarely | 12 | 10.9 |
| 35 years or older | Sometimes | 30 | 27.3 |
| 35 years or older | Most time | 44 | 40.0 |
| 35 years or older | Always | 23 | 20.9 |

Figure 5. Ability to take safety measures at work, by age group
Table 4-6. Barriers DCWs faced when trying to take safety measures at work
| Barriers | Number of Participants | Percentage (%) |
|---|---|---|
| Didn't have time while working | 8 | 6.7 |
| Job task didn't allow me | 50 | 41.7 |
| Lack of necessary facilities/infrastructures | 53 | 44.2 |
| Clients discouraged me | 50 | 41.7 |
| Co-workers discouraged me | 12 | 10.0 |
| Others | 2 | 1.7 |

Figure 6. Reasons and barriers for not being able to take safety measures at work
Table 4-7. How many barriers did a DCW face to take appropriate safety measures at work
| Number of Barriers | Number of Participants | Percentage (%) |
|---|---|---|
| 1 | 69 | 57.5 |
| 2 | 47 | 39.2 |
| 3 | 4 | 3.3 |
Sources for work safety information, and how many participants ranked them as top 5
Table 4-8a. Company intranet, webpage, and newsletters ranked for work safety information
| Company intranet, webpage, newsletters | Number of Participants | Percentage (%) |
|---|---|---|
Ranked as No. 1 | 88 | 31.3 |
Ranked as No. 2 | 70 | 24.9 |
Ranked as No. 3 | 39 | 13.9 |
Ranked as No. 4 | 26 | 9.3 |
Ranked as No. 5 | 23 | 8.2 |
Table 4-8b. Workplace posters/signage ranked for work safety information
| Workplace posters/signage | Number of Participants | Percentage (%) |
|---|---|---|
Ranked as No. 1 | 27 | 9.6 |
Ranked as No. 2 | 38 | 13.5 |
Ranked as No. 3 | 39 | 13.9 |
Ranked as No. 4 | 48 | 17.1 |
Ranked as No. 5 | 45 | 16.0 |
Table 4-8c. Employee safety manual/handbook ranked for work safety information
| Employee safety manual/handbook | Number of Participants | Percentage (%) |
|---|---|---|
Ranked as No. 1 | 30 | 10.7 |
Ranked as No. 2 | 31 | 11.0 |
Ranked as No. 3 | 31 | 11.0 |
Ranked as No. 4 | 30 | 10.7 |
Ranked as No. 5 | 32 | 11.4 |
Table 4-8d. Safety and health training and education ranked for work safety information
| Safety and health training and education | Number of Participants | Percentage (%) |
|---|---|---|
| Ranked as No. 1 | 28 | 10.0 |
| Ranked as No. 2 | 19 | 6.8 |
| Ranked as No. 3 | 28 | 10.0 |
| Ranked as No. 4 | 38 | 13.5 |
| Ranked as No. 5 | 49 | 17.4 |
Table 4-8e. Staff meetings or formal communication with manager/supervisor ranked for work safety information
| Staff meetings or formal communication with manager/supervisor | Number of Participants | Percentage (%) |
|---|---|---|
| Ranked as No. 1 | 17 | 6.0 |
| Ranked as No. 2 | 20 | 7.1 |
| Ranked as No. 3 | 24 | 8.5 |
| Ranked as No. 4 | 22 | 7.8 |
| Ranked as No. 5 | 44 | 15.7 |
Table 4-8f. Inform chat with co-workers ranked for work safety information
| Inform chat with co-workers | Number of Participants | Percentage (%) |
|---|---|---|
| Ranked as No. 1 | 20 | 7.1 |
| Ranked as No. 2 | 19 | 6.8 |
| Ranked as No. 3 | 24 | 8.5 |
| Ranked as No. 4 | 32 | 11.4 |
| Ranked as No. 5 | 12 | 4.3 |
Table 4-8g. Notification/announcement from employer ranked for work safety information
| Notification/announcement from employer | Number of Participants | Percentage (%) |
|---|---|---|
| Ranked as No. 1 | 17 | 6.0 |
| Ranked as No. 2 | 15 | 5.3 |
| Ranked as No. 3 | 29 | 10.3 |
| Ranked as No. 4 | 22 | 7.8 |
| Ranked as No. 5 | 16 | 5.7 |
Table 4-8h. Information from worker union ranked for work safety information
| Information from worker union | Number of Participants | Percentage (%) |
|---|---|---|
| Ranked as No. 1 | 13 | 4.6 |
| Ranked as No. 2 | 20 | 7.1 |
| Ranked as No. 3 | 13 | 4.6 |
| Ranked as No. 4 | 12 | 4.3 |
| Ranked as No. 5 | 17 | 6.0 |
Table 4-8i. Federal resources, such as the CDC, ranked for work safety information
| Federal resources, such as the CDC | Number of Participants | Percentage (%) |
|---|---|---|
| Ranked as No. 1 | 14 | 5.0 |
| Ranked as No. 2 | 17 | 6.0 |
| Ranked as No. 3 | 17 | 6.0 |
| Ranked as No. 4 | 19 | 6.8 |
| Ranked as No. 5 | 11 | 3.9 |
Table 4-8j. Local or state health departments ranked for work safety information
| Local or state health departments | Number of Participants | Percentage (%) |
|---|---|---|
| Ranked as No. 1 | 17 | 6.0 |
| Ranked as No. 2 | 10 | 3.6 |
| Ranked as No. 3 | 11 | 3.9 |
| Ranked as No. 4 | 15 | 5.3 |
| Ranked as No. 5 | 14 | 5.0 |
Table 4-8k. News media and other public websites ranked for work safety information
| News media and other public websites | Number of Participants | Percentage (%) |
|---|---|---|
| Ranked as No. 1 | 3 | 1.1 |
| Ranked as No. 2 | 12 | 4.3 |
| Ranked as No. 3 | 13 | 4.6 |
| Ranked as No. 4 | 11 | 3.9 |
| Ranked as No. 5 | 9 | 3.2 |
Table 4-8l. Families and friends outside of the workplace ranked for work safety information
| Families and friends outside of the workplace | Number of Participants | Percentage (%) |
|---|---|---|
| Ranked as No. 1 | 3 | 1.1 |
| Ranked as No. 2 | 8 | 2.8 |
| Ranked as No. 3 | 8 | 2.8 |
| Ranked as No. 4 | 3 | 1.1 |
| Ranked as No. 5 | 3 | 1.1 |
Table 4-8m. Social media and blogs ranked for work safety information
| Social media and blogs | Number of Participants | Percentage (%) |
|---|---|---|
| Ranked as No. 1 | 4 | 1.4 |
| Ranked as No. 2 | 2 | 0.7 |
| Ranked as No. 3 | 5 | 1.8 |
| Ranked as No. 4 | 3 | 1.1 |
| Ranked as No. 5 | 6 | 2.1 |

Figure 7.Common information sources about work safety during the pandemic
COVID infection and long COVID experience
3/4 of the participants tested positive for COVID-19 (including self-administered tests), among which 46% had their first COVID-19 infection as early as in 2020 (Table 5). 74% thought that half or more of the infection(s) were due to work-related factors (for example, contact with co-workers or clients). 60% of the infected participants had paid time off to recover, while 40% had not. 87% of the participants had at least one long COVID symptom (Having a wide range of symptoms and conditions that last 3 months or longer), and 69% reported having two symptoms or more. Common long COVID symptoms include difficulty thinking/concentrating/forgetfulness (35%), chest pain (32%), loss of taste or smell (30%), cough (30%), fast-beating or pounding heart (heart palpitations) (28%), and fever (27%) (Figure 8). Age and job tenure seem to not make a difference in experiencing long COVID symptoms. 34% said that their long COVID symptoms moderately impacted their daily activities, and another 40% reported that long COVID symptoms impacted them “very much” or “extremely.”
Detailed information about DCWs’ COVID infection and long COVID experience is shown in Table 5-1 to Table 5-8, and Figure 8.
Note: Unless otherwise indicated, the percentage was calculated excluding missing data.
Table 5-1. Tested positive for COVID-19
| Tested COVID Positive | Number of Participants | Percentage (%) |
|---|---|---|
| Yes | 212 | 74.9 |
| No | 71 | 25.1 |
Table 5-2. When did DCWs have their first COVID-19 Infection
| Time period | Number of Participants | Percentage (%) |
|---|---|---|
| Summer 2020 or before | 20 | 9.5 |
| Later in 2020 | 77 | 36.5 |
| 2021 | 52 | 24.6 |
| 2022 | 44 | 20.9 |
| 2023 | 18 | 8.5 |
Table 5-3. How many COVID-19 infections were work-related
| Number of Work-related COVID Infections | Number of Participants | Percentage (%) |
|---|---|---|
| None of the infection(s) | 17 | 8.1 |
| Less than half | 37 | 17.7 |
| About half | 76 | 36.4 |
| More than half | 72 | 34.4 |
| All of the infection(s) | 7 | 3.3 |
Table 5-4. Had paid time off to recover from COVID-19 infection
| Paid Time Off | Number of Participants | Percentage (%) |
|---|---|---|
| Yes | 127 | 60.5 |
| No | 83 | 39.5 |
Table 5-5a. Post-COVID Symptoms Lasting 3 Months or Longer, Overall
| Overall | Number of Participants | Percentage (%) |
|---|---|---|
| Yes | 181 | 87.0 |
| No | 27 | 13.0 |
Table 5-5b. Post-COVID Symptoms Lasting 3 Months or Longer, by Job Tenure
| Job Tenure | Experienced Symptoms lasting 3 months or longer | Number of Participants | Percentage (%) |
|---|---|---|---|
| Under 5 Years | Yes | 118 | 85.5 |
| Under 5 Years | No | 20 | 14.5 |
| 5 Years or More | Yes | 59 | 89.4 |
| 5 Years or More | No | 7 | 10.6 |
Table 5-5c. Post-COVID Symptoms Lasting 3 Months or Longer, by Age Group
| Age | Experienced Symptoms lasting 3 months or longer | Number of Participants | Percentage (%) |
|---|---|---|---|
| 34 years or younger | Yes | 110 | 87.3 |
| 34 years or younger | No | 16 | 12.7 |
| 35 years or older | Yes | 68 | 86.1 |
| 35 years or older | No | 11 | 13.9 |
Table 5-6. Long COVID symptoms that DCWs had
| Long COVID Symptoms | Number of Participants | Percentage (%) |
|---|---|---|
| Tiredness or fatigue | 53 | 29.3 |
| Difficulty thinking/concentrating/forgetfulness | 63 | 34.8 |
| Difficulty breathing | 44 | 24.3 |
| Fast-beating or pounding heart (heart palpitations) | 51 | 28.2 |
| Chest pain | 58 | 32.0 |
| Cough | 54 | 29.8 |
| Fever | 48 | 26.5 |
| Loss of taste or smell | 55 | 30.4 |
| Dizziness on standing | 32 | 17.7 |
| Joint or muscle pain | 35 | 19.3 |
| Headache | 34 | 18.8 |
| Depression, anxiety or mood changes | 31 | 17.1 |
| Others | 2 | 1.1 |

Figure 8. Long COVID symptoms experienced by NH Direct Care Workers (DCW)
Table 5-7. How many long COVID symptoms a DCW had
| Number of Long COVID Symptoms | Number of Participants | Percentage (%) |
|---|---|---|
| 0 | 28 | 13.4 |
| 1 | 38 | 18.2 |
| 2 | 42 | 20.1 |
| 3 | 30 | 14.4 |
| 4 | 30 | 14.4 |
| 5 | 22 | 10.5 |
| 6 | 16 | 7.7 |
| 7 | 2 | 1.0 |
| 8 | 1 | 0.5 |
Table 5-8. Did the long COVID symptom(s) impact daily activities
| Daily Activities Impacted | Number of Participants | Percentage (%) |
|---|---|---|
| Not at all | 6 | 3.4 |
| Slightly | 40 | 22.3 |
| Moderately | 61 | 34.1 |
| Very much | 49 | 27.4 |
| Extremely | 23 | 12.8 |
COVID-19 Vaccination
92% of the participants had at least one dose of the COVID-19 vaccine. Regarding reasons to get vaccination, more than 50% of the participants ranked “Protect myself” as the No. 1 reason, and 34% ranked “Protect family members” as the No. 2 reason (Table 6 & Figure 9). For participants who ranked at least one of the three, “Employer Mandates”, “Employer Incentives”, “Client requests” as top 5 reasons, we further asked if they would still choose to get the vaccination even if there were no mandates or mandatory requests. 11% of them answered they would probably or definitely not consider having the vaccination, and 30% reported that they “might or might not”. The pattern is more remarkable among people who ranked the three reasons above as one of their top reasons. For example, among people who ranked at least one of the reasons in their top 2, 65% of them reported they might reconsider their action (Figure 10).
Regarding the effectiveness of the COVID-19 vaccine, 26% of the participants believed that the COVID-19 vaccine definitely protected them and the people around them, followed by 37% who answered “probably yes,” leaving the other 37% as not quite sure about the COVID-19 vaccine’s effects.
Detailed information about COVID-19 vaccination is shown in Table 6-1 to Table 6-5, and Figure 9 to Figure 10.
Note: Unless otherwise indicated, the percentage was calculated excluding missing data.
Table 6-1. Had at least one dose of COVID-19 vaccine
| Had COVID Vaccine | Number of Participants | Percentage (%) |
|---|---|---|
| Yes | 260 | 91.9 |
| No | 23 | 8.1 |
Table 6-2a. Ranking of ‘Protect Myself’ as a Reason for COVID-19 Vaccination
| Protect myself | Number of Participants | Percentage (%) |
|---|---|---|
| Ranked as No. 1 | 129 | 50.8 |
| Ranked as No. 2 | 48 | 18.9 |
| Ranked as No. 3 | 25 | 9.8 |
| Ranked as No. 4 | 33 | 13 |
| Ranked as No. 5 | 12 | 4.7 |
Table 6-2b. Ranking of ‘Protect family members’ as a Reason for COVID-19 Vaccination
| Protect family members | Number of Participants | Percentage (%) |
|---|---|---|
| Ranked as No. 1 | 29 | 11.4 |
| Ranked as No. 2 | 86 | 33.9 |
| Ranked as No. 3 | 43 | 16.9 |
| Ranked as No. 4 | 34 | 13.4 |
| Ranked as No. 5 | 39 | 15.4 |
Table 6-2c. Ranking of ‘Protect people I supported’ as a Reason for COVID-19 Vaccination
| Protect people I supported | Number of Participants | Percentage (%) |
|---|---|---|
| Ranked as No. 1 | 15 | 5.9 |
| Ranked as No. 2 | 39 | 15.4 |
| Ranked as No. 3 | 53 | 20.9 |
| Ranked as No. 4 | 49 | 19.3 |
| Ranked as No. 5 | 28 | 11 |
Table 6-2d. Ranking of ‘I got sick with COVID’ as a Reason for COVID-19 Vaccination
| I got sick with COVID | Number of Participants | Percentage (%) |
|---|---|---|
| Ranked as No. 1 | 21 | 8.3 |
| Ranked as No. 2 | 14 | 5.5 |
| Ranked as No. 3 | 26 | 10.2 |
| Ranked as No. 4 | 45 | 17.7 |
| Ranked as No. 5 | 45 | 17.7 |
Table 6-2e. Ranking of ‘People around me got sick with COVID’ as a Reason for COVID-19 Vaccination
| People around me got sick with COVID | Number of Participants | Percentage (%) |
|---|---|---|
| Ranked as No. 1 | 22 | 8.7 |
| Ranked as No. 2 | 18 | 7.1 |
| Ranked as No. 3 | 19 | 7.5 |
| Ranked as No. 4 | 17 | 6.7 |
| Ranked as No. 5 | 58 | 22.8 |
Table 6-2f. Ranking of ‘I’m OK with the side effects’ as a Reason for COVID-19 Vaccination
| I’m OK with the side effects | Number of Participants | Percentage (%) |
|---|---|---|
| Ranked as No. 1 | 8 | 3.1 |
| Ranked as No. 2 | 9 | 3.5 |
| Ranked as No. 3 | 20 | 7.9 |
| Ranked as No. 4 | 22 | 8.7 |
| Ranked as No. 5 | 20 | 7.9 |
Table 6-2g. Ranking of ‘I believed in science’ as a Reason for COVID-19 Vaccination
| I believed in science | Number of Participants | Percentage (%) |
|---|---|---|
| Ranked as No. 1 | 14 | 5.5 |
| Ranked as No. 2 | 21 | 8.3 |
| Ranked as No. 3 | 25 | 9.8 |
| Ranked as No. 4 | 22 | 8.7 |
| Ranked as No. 5 | 18 | 7.1 |
Table 6-2h. Ranking of ‘Employer had vaccine mandate’ as a Reason for COVID-19 Vaccination
| Employer had vaccine mandate | Number of Participants | Percentage (%) |
|---|---|---|
| Ranked as No. 1 | 9 | 3.5 |
| Ranked as No. 2 | 12 | 4.7 |
| Ranked as No. 3 | 15 | 5.9 |
| Ranked as No. 4 | 9 | 3.5 |
| Ranked as No. 5 | 9 | 3.5 |
Table 6-2i. Ranking of ‘Employer provided incentives’ as a Reason for COVID-19 Vaccination
| Employer provided incentives | Number of Participants | Percentage (%) |
|---|---|---|
| Ranked as No. 3 | 1 | 0.4 |
| Ranked as No. 4 | 2 | 0.8 |
Table 6-2i. Ranking of ‘Clients required’ as a Reason for COVID-19 Vaccination
| Clients required | Number of Participants | Percentage (%) |
|---|---|---|
| Ranked as No. 1 | 3 | 1.2 |
| Ranked as No. 3 | 10 | 3.9 |
| Ranked as No. 4 | 4 | 1.6 |
| Ranked as No. 5 | 1 | 0.4 |
Table 6-2j. Ranking of ‘Doctor recommended me to take it’ as a Reason for COVID-19 Vaccination
| Doctor recommended me to take it | Number of Participants | Percentage (%) |
|---|---|---|
| Ranked as No. 1 | 1 | 0.4 |
| Ranked as No. 2 | 3 | 1.2 |
| Ranked as No. 3 | 8 | 3.1 |
| Ranked as No. 4 | 12 | 4.7 |
| Ranked as No. 5 | 13 | 5.1 |
Table 6-2k. Ranking of ‘Peer pressure’ as a Reason for COVID-19 Vaccination
| Peer pressure | Number of Participants | Percentage (%) |
|---|---|---|
| Ranked as No. 1 | 3 | 1.2 |
| Ranked as No. 2 | 3 | 1.2 |
| Ranked as No. 3 | 6 | 2.4 |
| Ranked as No. 4 | 3 | 1.2 |
| Ranked as No. 5 | 5 | 2 |
Table 6-2k. Ranking of ‘Wanted to participate in activities, such as travel’ as a Reason for COVID-19 Vaccination
| Wanted to participate in activities, such as travel | Number of Participants | Percentage (%) |
|---|---|---|
| Ranked as No. 2 | 1 | 0.4 |
| Ranked as No. 3 | 3 | 1.2 |
| Ranked as No. 4 | 2 | 0.8 |
| Ranked as No. 5 | 6 | 2.4 |

Figure 9. Common reasons to get COVID-19 vaccines
Table 6-3. Likelihood of receiving a COVID-19 vaccine without employer mandates, incentives, or client requests, among participants who listed this as one of their top reasons)
| Response | Top Five Reasons Number of Participants (Percentage %) | Top Two Reasons Number of Participants (Percentage %) |
|---|---|---|
Definitely not | 1 (1.5) | 1 (4.3) |
Probably not | 6 (9.0) | 4 (17.4) |
Might or might not | 20 (29.9) | 10 (43.5) |
Probably yes | 25 (37.3) | 7 (30.4) |
Definitely yes | 15 (22.4) | 1 (4.3) |

Figure 10. Intent to get the COVID-19 vaccine without mandates/incentives
Table 6-4. Do you think that the COVID-19 vaccine protected you and the people around you, among participants who ranked these reasons among their top five reasons for vaccination
| Perceived Effectiveness of the COVID-19 Vaccine | Number of Participants | Percentage (%) |
|---|---|---|
| Definitely not | 1 | 0.4 |
| Probably not | 42 | 14.8 |
| Might or might not | 62 | 21.9 |
| Probably yes | 104 | 36.7 |
| Definitely yes | 74 | 26.1 |
Table 6-5. Access to paid time off for COVID-19 vaccination and recovery among participants who ranked this factor among their top five reasons for vaccination
| Access to Paid Time Off for Vaccination and Recovery | Number of Participants | Percentage (%) |
|---|---|---|
| Yes | 164 | 58.8 |
| No | 115 | 41.2 |
Study Limitations
The study has several limitations. Despite our efforts in distributing the study survey through various academic networks related to NH DCWs and social media platforms, trying to reach the largest population, the survey sample may not be representative of NH DCWs. Further, participation in the survey was voluntary, opening to selection bias. The survey may be subject to recall bias due to self-reported data, especially considering the various dynamics during the COVID-19 pandemic. Regarding fraudulent responses, despite our due diligence in screening the data, it’s possible that some fraudulent responses were not excluded, nor were some valid responses included.
Conclusions
New Hampshire is ranked 18 among all 50 states and the D.C. in the PHI’s recent Direct Care Workforce State Index score based on worker-supportive policies and direct care workforce economics (Paraprofessional Healthcare Institute (PHI), 2024). The findings of our study suggest that DCWs in NH experienced work safety and health challenges during the COVID-19 pandemic, including insufficient safety equipment and protocols, psychological stress due to work schedule disruptions and other factors, as well as negative health outcomes such as COVID infections and long COVID. The study findings may serve as scientific evidence to promote safety measures addressing potential future infectious diseases outbreaks among the direct care workforce in New Hampshire, as well as other states experiencing the same issues.
References
- Bonett, S., Lin, W., Topper, P. S., Wolfe, J., Golinkoff, J., Deshpande, A., Villarruel, A., & Bauermeister, J. (2024). Assessing and Improving Data Integrity in Web-Based Surveys: Comparison of Fraud Detection Systems in a COVID-19 Study. JMIR Formative Research, 8(1), e47091. https://doi.org/10.2196/47091
- CDC. (2024a, April 23). Quality of Worklife Questionnaire. Stress at Work. https://www.cdc.gov/niosh/stress/worklife-question/index.html
- CDC. (2024b, August 21). NIOSH Worker Well-Being Questionnaire (WellBQ). Total Worker Health. https://www.cdc.gov/niosh/twh/php/wellbq/index.html
- Denny-Brown, N. (2020). COVID-19 Intensifies Nursing Home Workforce Challenges. US Department of Health and Human Services Assistant Secretary for Planning and Evaluation Behavioral Health, Disability, and Aging Policy.
- Feldman, P. H., Barrón, Y., Onorato, N., Russell, D., Sterling, M. R., & McDonald, M. (2023). Covid-19: Home Health Aides’ Perceived Preparedness and Self-Reported Availability for Work: Six Month Survey Results. New Solutions: A Journal of Environmental and Occupational Health Policy: NS, 33(2–3), 130–148. https://doi.org/10.1177/10482911231199449
- Paraprofessional Healthcare Institute (PHI). (2024). Direct Care Workforce State Index: Mapping Workforce Policies & Outcomes. https://www.phinational.org/state-index-tool/
- Pettingell, S., Bershadsky, J., Hewitt, A., Lahti Anderson, L., Hall, S., Smith, J., Sanders, M., Kleist, B., Zhang, A., & Oteman, Q. (2022). Direct Support Workforce and COVID-19 National Survey Report: 24-month Follow-up. Institute on Community Integration, University of Minnesota. https://publications.ici.umn.edu/community-living/covid19-survey-24-mon…
- Pozzar, R., Hammer, M. J., Underhill-Blazey, M., Wright, A. A., Tulsky, J. A., Hong, F., Gundersen, D. A., & Berry, D. L. (2020). Threats of Bots and Other Bad Actors to Data Quality Following Research Participant Recruitment Through Social Media: Cross-Sectional Questionnaire. Journal of Medical Internet Research, 22(10), e23021. https://doi.org/10.2196/23021
- Scales, K. (2020). It’s time to care: A detailed profile of America’s direct care workforces. https://www.phinational.org/wp-content/uploads/2020/01/Its-Time-to-Care…
- Scales, K. (2021). It Is Time to Resolve the Direct Care Workforce Crisis in Long-Term Care. The Gerontologist, 61(4), 497–504. https://doi.org/10.1093/geront/gnaa116
- Sterling, M. R., Tseng, E., Poon, A., Cho, J., Avgar, A. C., Kern, L. M., Ankuda, C. K., & Dell, N. (2020). Experiences of Home Health Care Workers in New York City During the Coronavirus Disease 2019 Pandemic: A Qualitative Analysis. JAMA Internal Medicine, 180(11), 1453–1459. https://doi.org/10.1001/jamainternmed.2020.3930
