The New Hampshire Occupational Health Surveillance Program recently completed an analysis of New Hampshire suicide death cases from 2018 to 2022 by demographics and employment (industry and occupation).
Suicide, defined as death caused by self-directed injurious behavior, is ranked the 12th leading cause of death overall in the U.S, claiming the lives of over 45,000 people in 2020. The suicide rate in the U.S. increased 35% from 10.4 per 100,000 population in 2000 to 14.2 in 2018 (National Institute of Mental Health, NIH, 2023).
In New Hampshire, in 2017, suicide was the 8th leading cause of death (with a suicide rate of 19.0 per 100,000 population) -- higher than the national average (New Hampshire Division of Public Health Services & Injury Prevention Center at the Children’s Hospital at Dartmouth- Hitchcock, 2018).
Suicides from 2018-2022
- There were 1,165 suicides in New Hampshire from 2018 to 2022, accounting for 1.8% of all deaths occurred in the five years, with both the number and percentage decreasing over the five-year period (See Table 1)
|
Year |
Number of suicides |
Percentage of all deaths (%) |
|---|---|---|
|
2018 |
272 |
2.1 |
|
2019 |
249 |
2.0 |
|
2020 |
229 |
1.7 |
|
2021 |
214 |
1.5 |
|
2022 |
201 |
1.6 |
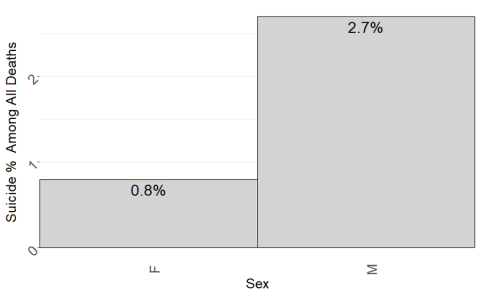
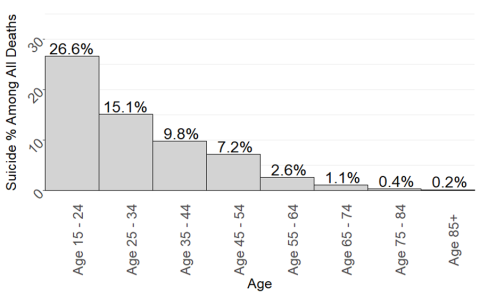
Suicides by gender and age
- The percentage of suicides among all deaths for males had the highest was 2.7%, as compared to 0.8% for females.
- The youngest age group (15-24) had the highest percentage of suicides as 26.6%.
Suicides by employment
Top industry sectors and occupations with the highest number of suicides are listed in Table 2-3:
|
Industry Sector |
Number of Suicides |
|---|---|
|
Construction |
179 |
|
Manufacturing |
128 |
|
Non-paid workers |
119 |
|
Occupation |
Number of Suicides |
|---|---|
|
Construction and extraction |
167 |
|
Management |
87 |
|
Production |
86 |
Top industry sectors and occupations with the highest percentage of suicides are listed in Table 4-5:
|
Industry Sector |
Proportional Mortality (%) |
|---|---|
|
Mining, Quarrying, and Oil and Gas Extraction* |
6.0 |
|
Construction |
3.6 |
|
Administrative and Support and Waste Management |
3.4 |
* Due to small sample size in this sector, the estimate may not be precise.
|
Occupation |
Proportional Mortality (%) |
|---|---|
|
Student (Unpaid) |
31.4 |
|
Farming, Fishing, and Forestry Occupations |
4.1 |
|
Construction and Extraction Occupations |
3.9 |
For more information and details about the study, contact Liu Yang, Project Director.
References
National Institute of Mental Health, NIH. (2023). Mental health information—Statistics—Suicide.
New Hampshire Division of Public Health Services, & Injury Prevention Center at the Children’s Hospital at Dartmouth- Hitchcock. (2018). State of New hampshire: Violence and Injury Prevention 5-Year Plan (PDF) (pp. 1–78).